A weekly update describing soil moisture across the country to help assess whether severely to extremely dry conditions are occurring or imminent. Regions experiencing these soil moisture deficits are deemed “hotspots”. Persistent hotspot regions have the potential to develop into drought.
Facts: Soil Moisture
Soil moisture levels across the North Island have stayed largely unchanged when compared to this time last week with the exception of the Manawatu-Wanganui region and Central Hawke’s Bay where soil moisture decreased. Soil moisture from Wellington east and north to the southern border of the Hawke’s Bay region increased slightly but is still considered to be severely to extremely drier than normal for this time of year. Farther north, much drier to severely drier than normal soils for this time of year exist over central and eastern Waikato and parts of the Bay of Plenty. Areas of much drier to severely drier than normal soils for this time of year are also present in Auckland and Northland.
In the South Island, active weather over the weekend brought much-needed rain to some key hotspot areas from Marlborough, along the east coast through to northern Otago. Despite the slight increase in soil moisture in the aforementioned areas, levels remain much drier to severely drier than normal for this time of year. In particular, the far eastern Tasman and Marlborough regions as well as parts of Canterbury and Central Otago are hotspot areas. Soil moisture along the West Coast remains near normal while southern Southland currently has slightly wetter than normal soils for the time of year.
Outlook
For the North Island, a ridge of high pressure will keep the weather settled and dry from Saturday through to Wednesday. Around about that mid-week mark, a weak front is expected to make its way across the island bringing with it limited rain, particularly for southern parts of the island. Any rain is likely to be short-lived with the return of high pressure and stable weather shortly thereafter. Consequently, soil moisture levels are likely to remain the same or decrease for much of the island by this time next week.
Similarly, for the South Island a mostly dry weekend is on the cards. A front is expected to make its way across the island from Monday evening through to Tuesday with the majority of the rain remaining west of the Divide. Showers and lighter rain may reach some eastern areas throughout Tuesday. Thereafter a large high pressure system is expected to move in and therefore eliminate the chance of further rain by this time next week. As a result, soil moisture levels across the entire South Island are expected to decrease slightly by this time next week.
For the North Island, a hotspot exists from the Wairarapa to east of Wellington City. We are watching for potential hotspot development by this time next week over portions of the east and southeast Waikato as well as portions of the Auckland and Northland regions, chiefly north of Auckland City.
For the South Island, hotspots exist in eastern Canterbury and parts of northern Otago, as well as much of the area from Marlborough to eastern Tasman.
Background
Soil moisture deficit
Soil moisture deficit is the amount of water needed to bring the soil moisture content back to field capacity, which is the maximum amount of water the soil can hold.
Soil moisture anomaly
Soil moisture anomaly the difference between the historical normal soil moisture deficit (or surplus) for a given time of year and actual soil moisture deficits.
Definitions
“Extremely” and “severely” dry soils are based on a combination of the current soil moisture status and the difference from normal soil moisture (see soil moisture maps at https://www.niwa.co.nz/climate/nz-drought-monitor/droughtindicatormaps)
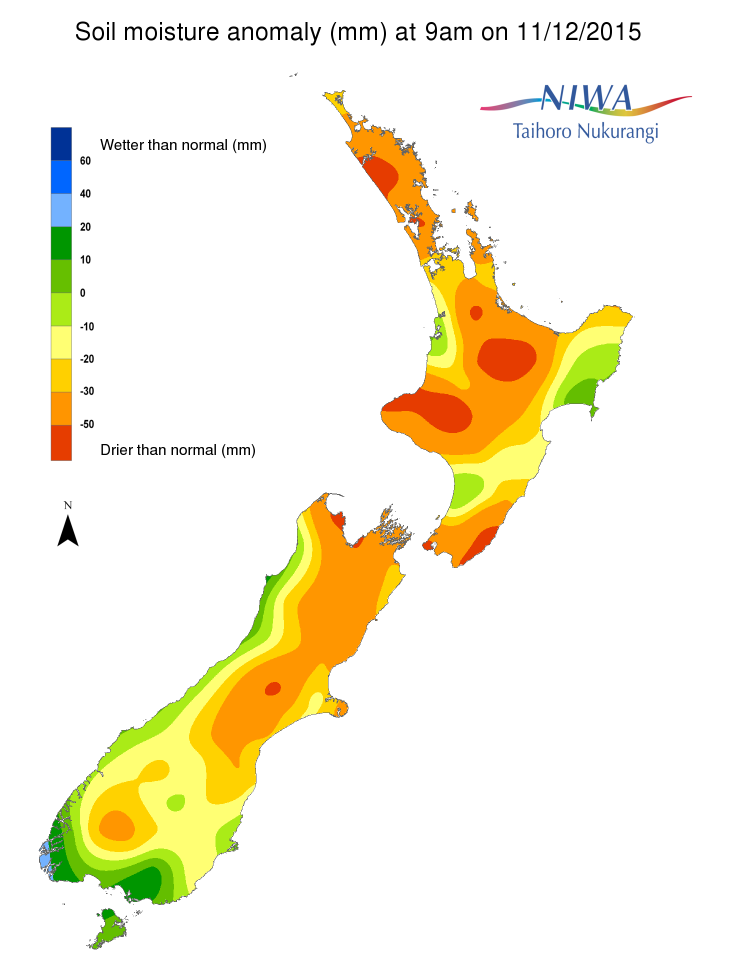
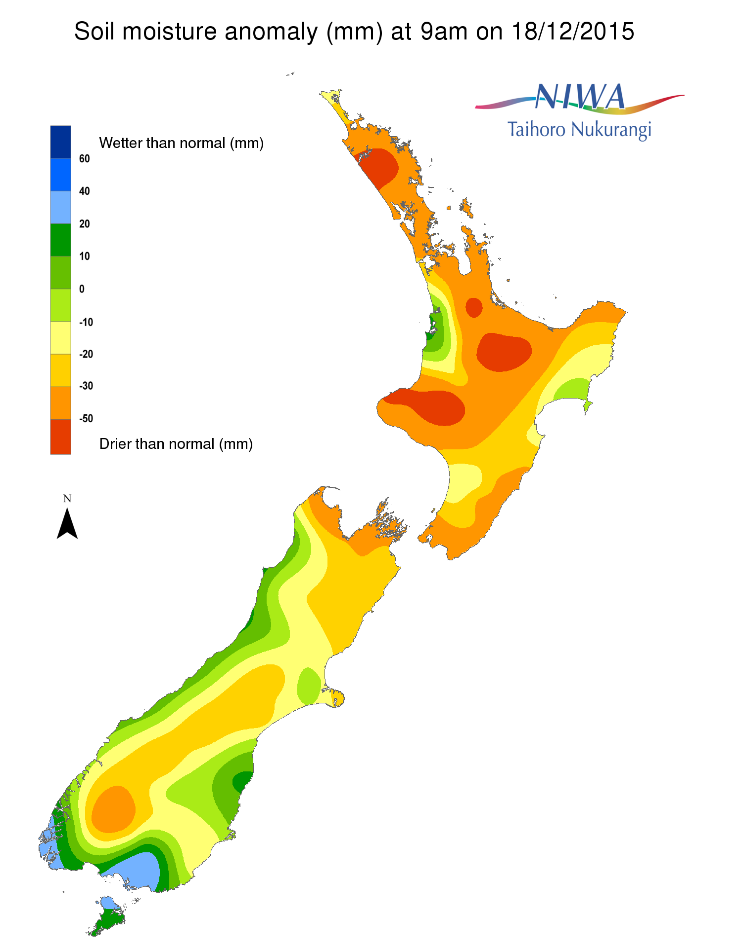
Soil moisture anomaly maps
Pictured below are soil Moisture Anomaly Maps, relative to this time of year. The maps show soil moisture anomaly for the past two weeks.