Weekly update to help media assess likelihood of extremely dry weather preceding a drought. Regions experiencing severely to extremely drier than normal soils conditions are deemed “hotspots”.
Facts: Soil Moisture
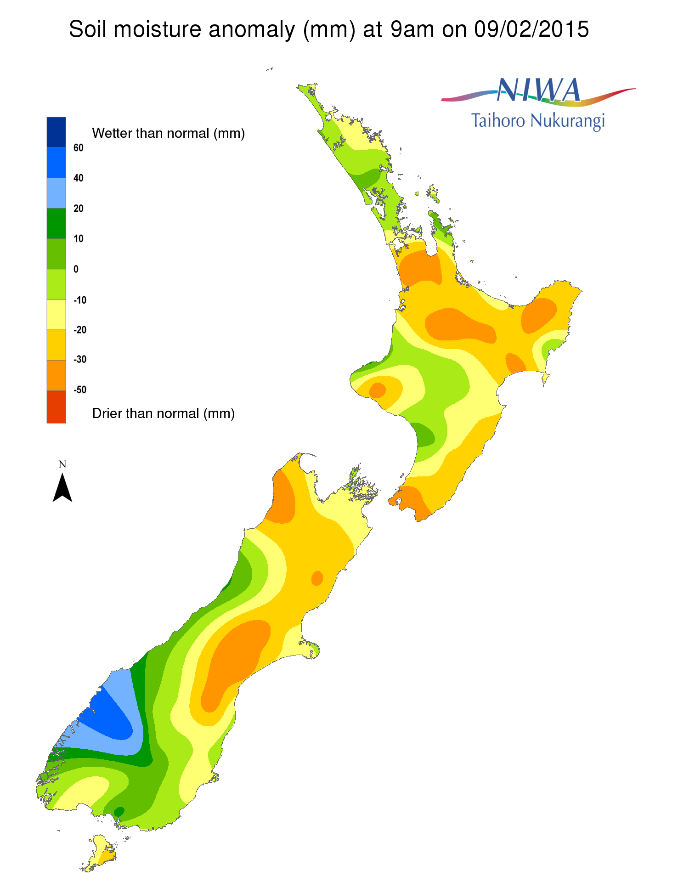
For the North Island, soil moisture levels remain much drier than normal for this time of year for most of the island. Areas severely to extremely drier than normal soil moisture persist in the Waikato, southern Taranaki, Wellington, Wairarapa, Hawke’s Bay, Gisborne, Bay of Plenty, southern Auckland and northeast Northland regions.
For the South Island, soil moisture levels remain much drier than normal for this time of year for most locations along and east of the Divide as well as southern and western parts of Southland. Severely to extremely drier than normal soil moisture levels for this time of year remain in drought declared regions of northern Otago, Canterbury and Marlborough regions. Additionally, soils are severely to extremely drier than normal for this time of the year for the Nelson and eastern parts of the Tasman regions. Conversely, wetter than normal soils for this time of year are present for coastal areas of northern Southland and southern West Coast regions.
Week-to-Week Comparison
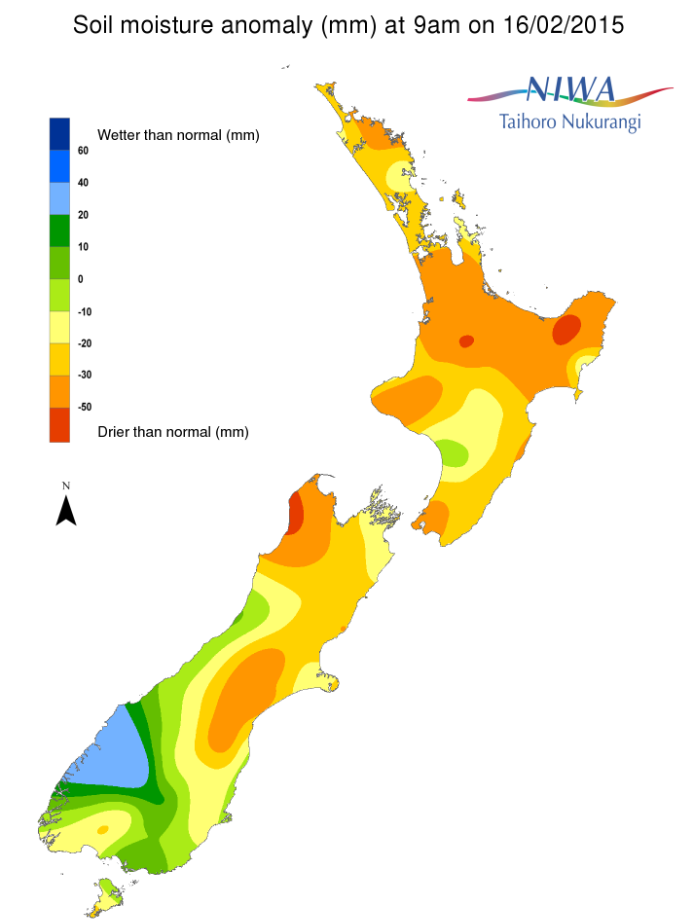
For the North Island, when compared to this time last week there has been a clear expansion of the size where drier than normal soils exist in the Taranaki, Auckland and Northland regions. Moreover, the area of severely to extremely drier than normal soils has grown over the Waikato, Bay of Plenty, Gisborne and Hawke’s Bay regions.
For the South Island, no significant change in soil moisture levels are evident for most of the island. The exception is for the Banks Peninsula where soils have trended drier than normal for this time of year over the past seven days. However, the most noticeable change is for the Nelson and eastern Tasman regions where soils are now much drier than normal to severely or extremely drier than normal for this time of year, respectively.
Commentary
For the North Island, when considering the current soil moisture anomalies for this time of year, areas for, south Taranaki, Wellington, Wairarapa, Hawke’s Bay, Gisborne, Bay of Plenty regions are a hotspot areas. Additional hotspot areas include the southern Auckland and northeast Northland regions. Overall, the driest soils relative to this time of year are present over the central Waikato and areas adjacent to the Gisborne/Bay of Plenty boarder.
For the South Island, a hotspot area persists in the drought stricken north Otago, Canterbury and Marlborough regions. A newly formed hotspot area has developed in the Nelson and eastern Tasman regions.
For hotspot regions, sustained rainfall over an extended period of time is needed to return conditions back to normal.
Background:
Hotspot Watch a weekly advisory service for New Zealand media. It provides soil moisture and precipitation measurements around the country to help assess whether extremely dry conditions are imminent.
Soil moisture deficit: the amount of water needed to bring the soil moisture content back to field capacity, which is the maximum amount of water the soil can hold.
Soil moisture anomaly: the difference between the historical normal soil moisture deficit (or surplus) for a given time of year and actual soil moisture deficits.
Definitions: “Extremely” and “severely” dry soils are based on a combination of the current soil moisture status and the difference from normal soil moisture (see soil moisture maps at https://www.niwa.co.nz/climate/nz-drought-monitor/droughtindicatormaps)
Pictured below: Soil Moisture Anomaly Maps, relative to this time of year. On the left are values this time last week. On the right are the most recent values.