PDF of this article (892 KB)


Harmless enough when your dentist uses it for anaesthesia, N2O shows its darker side as a major component of New Zealand’s greenhouse-gas emissions. Keith Lassey and Mike Harvey explain why our emission levels are so high and how we might reduce them.
Nitrous oxide (N2O ) is one of several oxides of nitrogen. It’s colourless, non-toxic, and very stable; on average, it resides some 120 years in the atmosphere before being broken down by ultraviolet radiation in the stratosphere. Nitrous oxide has many uses, ranging from anaesthesia and pain-killer in medicine and dentistry (where it’s known as laughing gas due to the euphoria it can induce) to high-performance racing engines, where it can be used to boost combustion. N2O should not be confused with nitrogen dioxide (N2O ), which is generated during internal combustion processes and forms a toxic brown haze in many urban environments.
Sources of nitrous oxide
Globally, more than two thirds of natural N2O emissions come from soils as a by-product when microbes break down soil nutrients through nitrification and denitrification. The remaining third arises from microbial breakdown of biological material in the oceans. Annually, about 10 million tonnes of nitrogen enters the atmosphere as N2O. Agricultural practices have increased the levels of soil nitrogen and thence N2O emissions. Two particular culprits are the widespread use of synthetic nitrogen fertilisers since the mid-1900s, and intensive pastoral farming where animal wastes are returned to the soils. Relatively minor N2O sources include certain industrial processes, such as the manufacture of nylon, and combustion processes. Together, these anthropogenic emissions (from human activities) now almost match natural emissions and are responsible for atmospheric concentrations of N2O rising by about 18% over three centuries and still rising.
N2O in New Zealand’s greenhouse gas profile
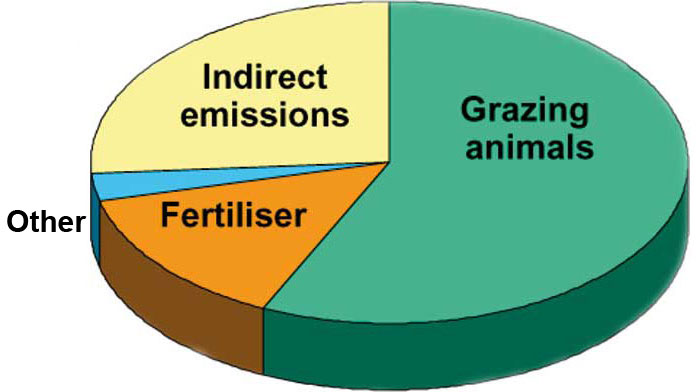
In New Zealand, nitrogen is added to soils mainly through grazing animals’ urine and dung; nitrogen-based fertiliser is also an important source (see first pie graph). The resulting N2O emissions, together with the methane that is belched by ruminant livestock, give New Zealand the highest per-capita emission of agricultural greenhouse gases in the developed world. Close to 50% of our greenhouse gas emissions are from the agricultural sector; the rest is dominated by CO2 from energy generation and transport. This is by far the highest proportion of agricultural emissions among developed countries.
Like all countries that have ratified the UN Framework Convention on Climate Change (UNFCCC), we report our anthropogenic emissions annually. The most recent report (2003) is summarised by gas in the second pie graph, which shows that emissions of N2O, predominantly from farming, account for nearly 18% of all our anthropogenic emissions. UNFCCC requires us to monitor our major emission sources and develop policies and strategies to mitigate them. This has spawned a lot of research to better quantify and understand our agricultural N2O emissions.
How do we measure emissions?
Levels of atmospheric N2O are quite low, approximately 319 parts per billion (ppb), and not easy to measure accurately. The low concentration belies its relatively large impact as a greenhouse gas, in part because every kg of N2O added to the atmosphere is about 310 times more potent as a greenhouse gas than a kg of CO2 (see ‘Comparing gases’).
One method of measuring emission rates is to cover small areas of pasture with sealed chambers and measure the concentrations of N2O that accumulate over a few hours. This would normally be accompanied by soil core sampling in order to determine the amount of nitrogen available to soil microbes, and thereby enable the processes to be studied. Difficulties with the chamber method include: the possible disturbance they impose on the soils and soil processes; the patchiness of emissions (for example, emissions are strongest from animal urine or fertiliser patches); that microbial breakdown is quite protracted and emissions can persist for several months after deposition; and that emission rates can change rapidly with atmospheric conditions, especially following rainfall. Chamber methods are therefore bolstered by micrometeorological techniques that measure and interpret detailed variations in N2O in the atmosphere near the sources without disturbing the soils.
Options for reducing agricultural emissions
About 1% of the nitrogen applied to the soil is believed to be lost directly to the atmosphere as N2O. Other nitrogen gases are also produced and emitted, and water-borne nitrogen compounds can leach into groundwater or local waterways and lead to eutrification (oxygen depletion through decomposition) as well as to indirect N2O production. The less nitrogen that is lost in these ways, the better for the farmer, who wants to gain maximum benefit from his investment in fertiliser, and the better for the environment. Both farmer and environment can therefore benefit from targeting the fertilisation to provide what the plants need when they most need it and avoiding times when microbial action (mainly nitrification) is at its most vigorous, such as following rainfall. Another strategy would be to apply nitrification inhibitors that allow the plants to take up the nitrogen with reduced competition from nitrifying microbes. Both of these N2O-reducing strategies are proposed in the Government’s recent discussion document for sustainable farming practices: ‘Sustainable land management and climate change’.
Comparing gases
The internationally agreed method for comparing different greenhouse gases is to express each as ‘CO2 equivalent’ emissions, according to their effectiveness at absorbing infrared radiation over a period of 100 years. On this basis, 1 kg of N2O emission is equivalent to 310 kg CO2, and 1 kg of methane (CH4) is equivalent to 21 kg CO2.
No laughing matter
- Nitrous oxide occurs naturally from microbial action in soils and the seas, but mankind has increased the rate of emissions, primarily through agricultural expansion.
- In New Zealand, N2O mainly originates from animal wastes and nitrogen-based fertilisers.
- Targeting fertiliser use, and use of additives, could help reduce our N2O emissions.
Useful links
Sustainable land management and climate change, a document for public consultation: www.maf.govt.nz/climatechange
For more detail on the Government’s climate-change policies: www.climatechange.govt.nz
Further breakdown of NZ emissions are on the same website: www.climatechange.govt.nz/reducing-our-emissions/index.html
Holland, E.A.; Lee-Taylor, J.; Nevison, C.; Sulzman, J. (2005). Global N cycle: fluxes and N2O mixing ratios originating from human activity. The dataset is available online from the Oak Ridge National Laboratory Distributed Active Archive Center: www.daac.ornl.gov/data/global_climate/global_N_cycle/comp/global_N_perturbations.pdf
Dr Keith Lassey and Dr Mike Harvey study greenhouse gases and atmospheric emissions; they are both based at NIWA in Wellington.
Teachers’ resource for NCEA Achievement Standards or Unit Standards: Geography Level 1 AS90207, Level 2 AS90336 Science Level 2 US6352, AS90771, Level 3 US6355 See other curriculum connections