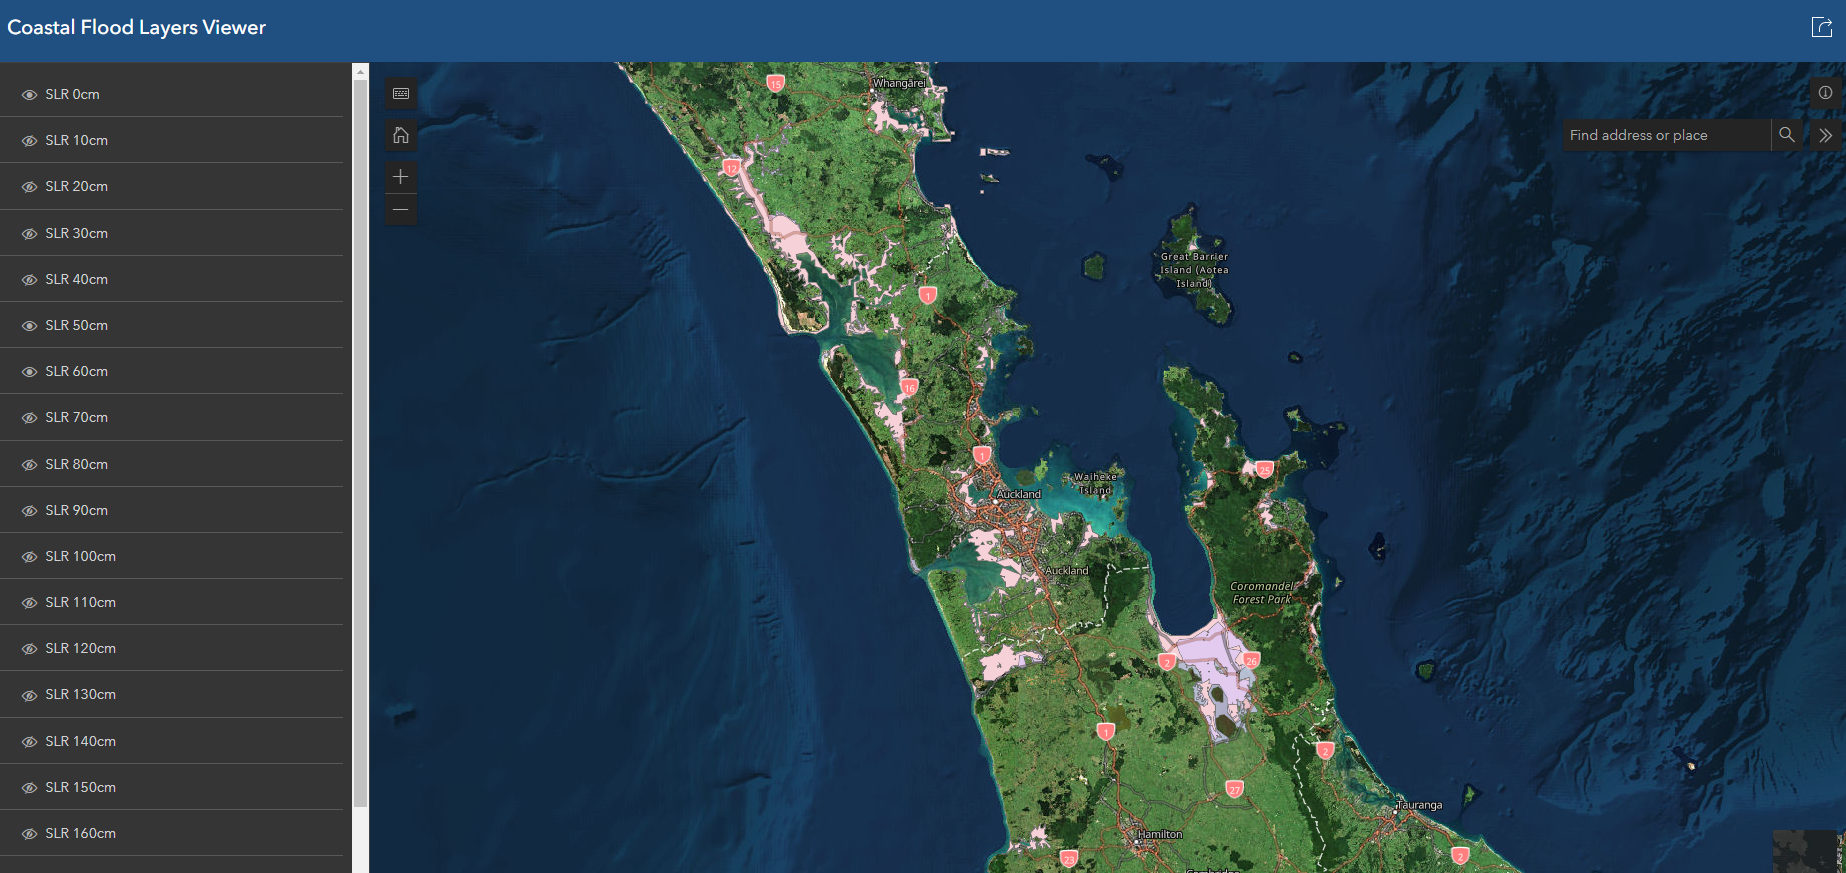
Go to online flood map ArcGIS tool
Coastal flooding is a global hazard that also impacts Aotearoa New Zealand. Rising sea level is already causing more frequent flooding along many coasts and will greatly increase the frequency and consequences of flooding in future.
Decisions about how we adapt to sea-level rise need to be based on information about our exposure to coastal flooding, both now and in the future after a period of rising sea levels.
The maps and data linked from this page provide a modelled representation of New Zealand’s 1% annual exceedance probability (AEP) extreme sea level flooding under current climatic sea conditions, plus relative sea level rise up to 2m above present-day mean sea level. 1% AEP means conditions that have a 1% chance of occurring in any given year (and average likelihood of occurring once every 100 years) – in the case of coastal flooding, these conditions are likely to happen during a storm event with large tides, waves and storm surge.
This Extreme coastal flood map dataset comprises 21 coastal flooding scenarios representing relative sea-level rise ranging from 0 to 2 metres in 10 cm (0.1 m) increments. According to the Ministry for the Environment, 1.0 m of sea-level rise can be expected by the end of this century, or even sooner in places where land is subsiding.
The data is based on analysis of sea-level measurements and numerical models and was verified against sea-level runup observations collected after large storm-tide events. Flooding was mapped using a static (‘bathtub’) methodology. Nationwide coverage for low-lying coastal land was achieved using a composite topographical dataset comprised of Airborne Light Detection and Ranging (LIDAR) and bias corrected Shuttle Radar Topography Mission (SRTM).
The main purpose of the Extreme coastal flood map dataset is to identify national and jurisdictional level flood hazard and exposure trends. Users should critically assess map accuracy and limitations to determine their appropriateness for hazard and exposure analysis at higher resolutions (e.g., property level).
Further information about this tool is provided in the accompanying technical report: Coastal flood mapping methodology report.
For the best experience this tool should be viewed on a tablet, laptop, or computer.
Using this tool together with the NZ SeaRise projections
The Ministry for the Environment has released Interim guidance on the use of new sea-level rise projections for NZ.
Section 1.1 of the Coastal flood mapping methodology report shows how to use these extreme coastal flood maps together with sea-level rise projections.
Coastal flood maps available from councils
Several councils across New Zealand provide coastal hazard maps for their area and, in many cases, these are higher resolution than the NIWA maps. For example:
- Auckland Council
- Bay of Plenty Regional Council (coming soon; for this reason, this region has been temporarily removed from the NIWA tool).
- Nelson City Council
- Northland Regional Council
- Tasman District Council
- Waikato Regional Council
- Wellington Regional Council
- Thames Coromandel District Council (Shoreline Management Pathways Project)
Go to online flood map ArcGIS tool
Further information
Please acknowledge or cite the Extreme sea level flood maps (1% AEP and up to 2m sea-level rise) for Aotearoa by referencing this publication as appropriate: Paulik, R., Wild, A., Stephens, S., Welsh, R., Wadhwa, S. (2023) National assessment of extreme sea-level driven inundation under rising sea levels. Frontiers in Environmental Science, 10, 2633, https://doi.org/10.3389/fenvs.2022.1045743.
Disclaimer
The National Institute of Water & Atmospheric Limited (NIWA) have provided maps and data on coastal flooding exposure from a large storm tide (with an estimated 1% annual exceedance probability in present climate), plus relative sea-level rise of up to 2 m above the present-day mean sea level. The data was produced at a whole of New Zealand scale and was not designed to replace more detailed regional or local data where available. The data is an estimate only and subject to uncertainty. We make no representations or warranties as to the data and shall not be liable to any person who uses or relies on the data or this ARCGIS online portal, on any ground, for any loss, damage or expense arising from such use or reliance.
More coastal flooding information is available
In addition to the 1% AEP scenario provided here, NIWA has also mapped 39, 18, 10, 5, 2, 1, 0.5, 0.2 and 0.1 % AEP scenarios (equivalent to return periods of 2, 5, 10, 20, 50, 100, 200, 500 and 1000-years). All of these scenarios have additional RSLR increments added up to 2 m above present-day mean sea level.
These additional ARCGIS layers are available here.
Acknowledgements
The research was funded by the New Zealand Ministry of Business, Innovation and Employment (MBIE) under:
- Strategic Science Investment Fund (MBIE Contract C01X1703)
- Deep South National Science Challenge (MBIE Contract C01X1902), and
- NZ SeaRise Programme (MBIE Contract: RTVU1705).
