NIWA and West Coast Regional Council (WCRC) are working together to help the South Island West Coast community participate in water allocation planning.
The National Policy Statement for Freshwater Management (NPSFM, 2011) requires that regional councils set water quantity limits for all freshwater rivers and streams. Water quantity limits must include at least a minimum flow and an allocation (or take) rate. Defining limits that effectively balance both in and out-of-stream water uses, while also accounting for spatial variability in the environment at multiple scales, is a significant challenge but the task is easier if they are developed using readily “digestible” scientific tools and are transparently linked to clear objectives for both environmental outcomes and water use.
Also, a key part of the limit setting process is community engagement, ranging from participation on water-use plan committees to public meetings where the consequences of possible water-use plans on community values are explained, discussed, and ultimately assigned weightings.
Motivation
These points motivated West Coast Regional Council in partnership with NIWA to seek support from MfE’s Community Engagement Fund (CEF) to undertake a project that would use two of NIWA’s science-based water allocation decision-support tools (EFSAP and CHES) to inform and assist the regional community in determining water quantity limits. The intent is also for this West Coast project to serve as a case example for other regions of the country.
The CEF application was successful, and the project is now underway.
The Environmental Flows Strategic Assessment Platform
The Environmental Flows Strategic Assessment Platform (EFSAP) is a regional-scale planning tool aimed at optimising water allocation limit-setting by evaluating the effects of allowable water take and minimum residual flows on in-stream values (such as ecological health and whitebait fisheries) and reliability of water-use (such as for irrigation).
Cumulative Hydrological Effects Simulator
In contrast, the Cumulative Hydrological Effects Simulator (CHES) aims to evaluate and compare the effects of specific water use and regulation scenarios on in-stream values and water-use reliability at finer scales, and is based on generating flow time-series records everywhere across a catchment. Its output can include grading river segments in terms of meeting environmental bottom lines for flow–related attributes (such as minimum flows for native fish species, flow requirements for iwi values). CHES is being applied to the Grey River Catchment.
Application of tools
Once set up, both tools can be used to near-instantly inform on the effects of changes to water-use scenarios or allocation limits. Moreover, they provide output in the form of colour-coded river network maps and summary diagrams/tables that are ideally suited for helping community groups to explore options and consequences or for council officers to evaluate the effects of a particular proposed water-use scheme within the context of existing uses.
While NIWA are providing the tools and doing the initial model ‘builds’, WCRC staff are being trained in their use so that the tools can be applied more widely and new water use/management scenarios evaluated (such as storage reservoirs) in-house.
Regional, public workshops will first demonstrate the approaches underlying the tools and gather data from the community on in-stream values and water-take requirements (such as reliability of supply), then will provide the opportunity for ‘hands-on’ evaluation of the effects of different combinations of water allocation limits and water-use scenarios.
Progress to date
To date, data is still being compiled for the Grey CHES build, but EFSAP has been used to simulate the consequences of various potential sets of minimum flow and total allocation limits on nine West Coast catchments. This includes comparing the effects of WCRC’s current limits with the proposed National Environmental Standard (NES) interim limits.
Indicator species were selected based on their presence and value in the West Coast region as well as their range in physical habitat requirements, and included brown trout, longfin eel, mayfly, inanga, upland bully, and bluegill bully. Out-of-stream values were represented by reliability of water supply.
Examples of outputs
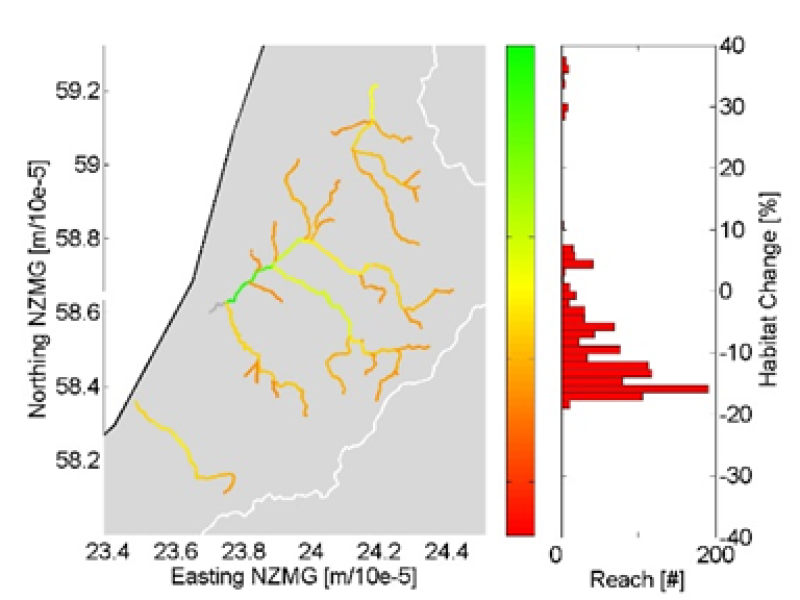
As an example of EFSAP output, Figure 1 maps, for “large” rivers (where the mean flow exceeds 5 m3/s), the time-averaged percentage change in physical habitat (relative to natural flows) for adult brown trout (which were found to be the most sensitive species to habitat change) if full abstraction was allowed up to the interim NES limits for “large” rivers.
This shows a small to moderate (0-20%) reduction in habitat for most large rivers. The decision-support diagram (Figure 2) shows the sensitivity of the change in adult brown trout habitat to using different proportions of the mean annual low flow (MALF) to define limits on minimum flows and maximum take.
The NES “large” river limit is shown by the blue circle, while the black dotted box identifies the combinations that would ensure that none of the indicator species would lose more than 15% of their physical habitat while also ensuring a greater than 95% reliability of water take.
External contact: West Coast Regional Council (WCRC) - Stefan Beaumont.


