2018: New Zealand’s equal-2nd warmest year on record
|
Temperature |
Annual temperatures were above average (+0.51°C to +1.20°C above the annual average) across the majority of New Zealand, including much of the North Island as well as the western and southern South Island. A small strip of well above average (>1.20°C from average) temperatures were observed in southern Manawatu-Whanganui. Elsewhere, near average (within -0.50°C to +0.50°C of average) temperatures occurred in parts of southern Canterbury, Otago, small parts of Auckland and the Far North. 2018 was the equal 2nd-warmest year on record for New Zealand, based on NIWA’s seven-station series which began in 1909. |
|
Rainfall |
Yearly rainfall in 2018 was above normal (120-149% of the annual normal) across much of the eastern and upper South Island, as well as parts of Wellington, Wairarapa, Bay of Plenty, northern Waikato, and Auckland. Well above normal rainfall (>149% of normal) was observed in portions of southern Canterbury. Rainfall was near normal (80-119% of normal) for the remainder of New Zealand. |
|
Soil moisture |
2018 began with below or well below normal soil moisture nearly nationwide, but soil moisture in the North Island and upper South Island gradually increased during January. Widespread heavy rainfall from ex-tropical cyclones Fehi and Gita during February resulted in well above normal soil moisture across most of New Zealand. Near to above normal soil moisture persisted through autumn, with near normal soil moisture widespread during the winter. During spring, soils became drier than normal in much of the country, although remained wetter than normal in southern Canterbury and Otago. Heavy rain in November brought widespread wetter than normal soils to the east of both islands, while a heavy rain event around Christmas did the same for the upper North Island. As of 1 January, soils were much wetter than normal in the upper and eastern North Island, and large portions of the eastern South Island. Soils were drier than normal in parts of Taranaki, Tasman, West Coast, and Southland. |
|
Sunshine |
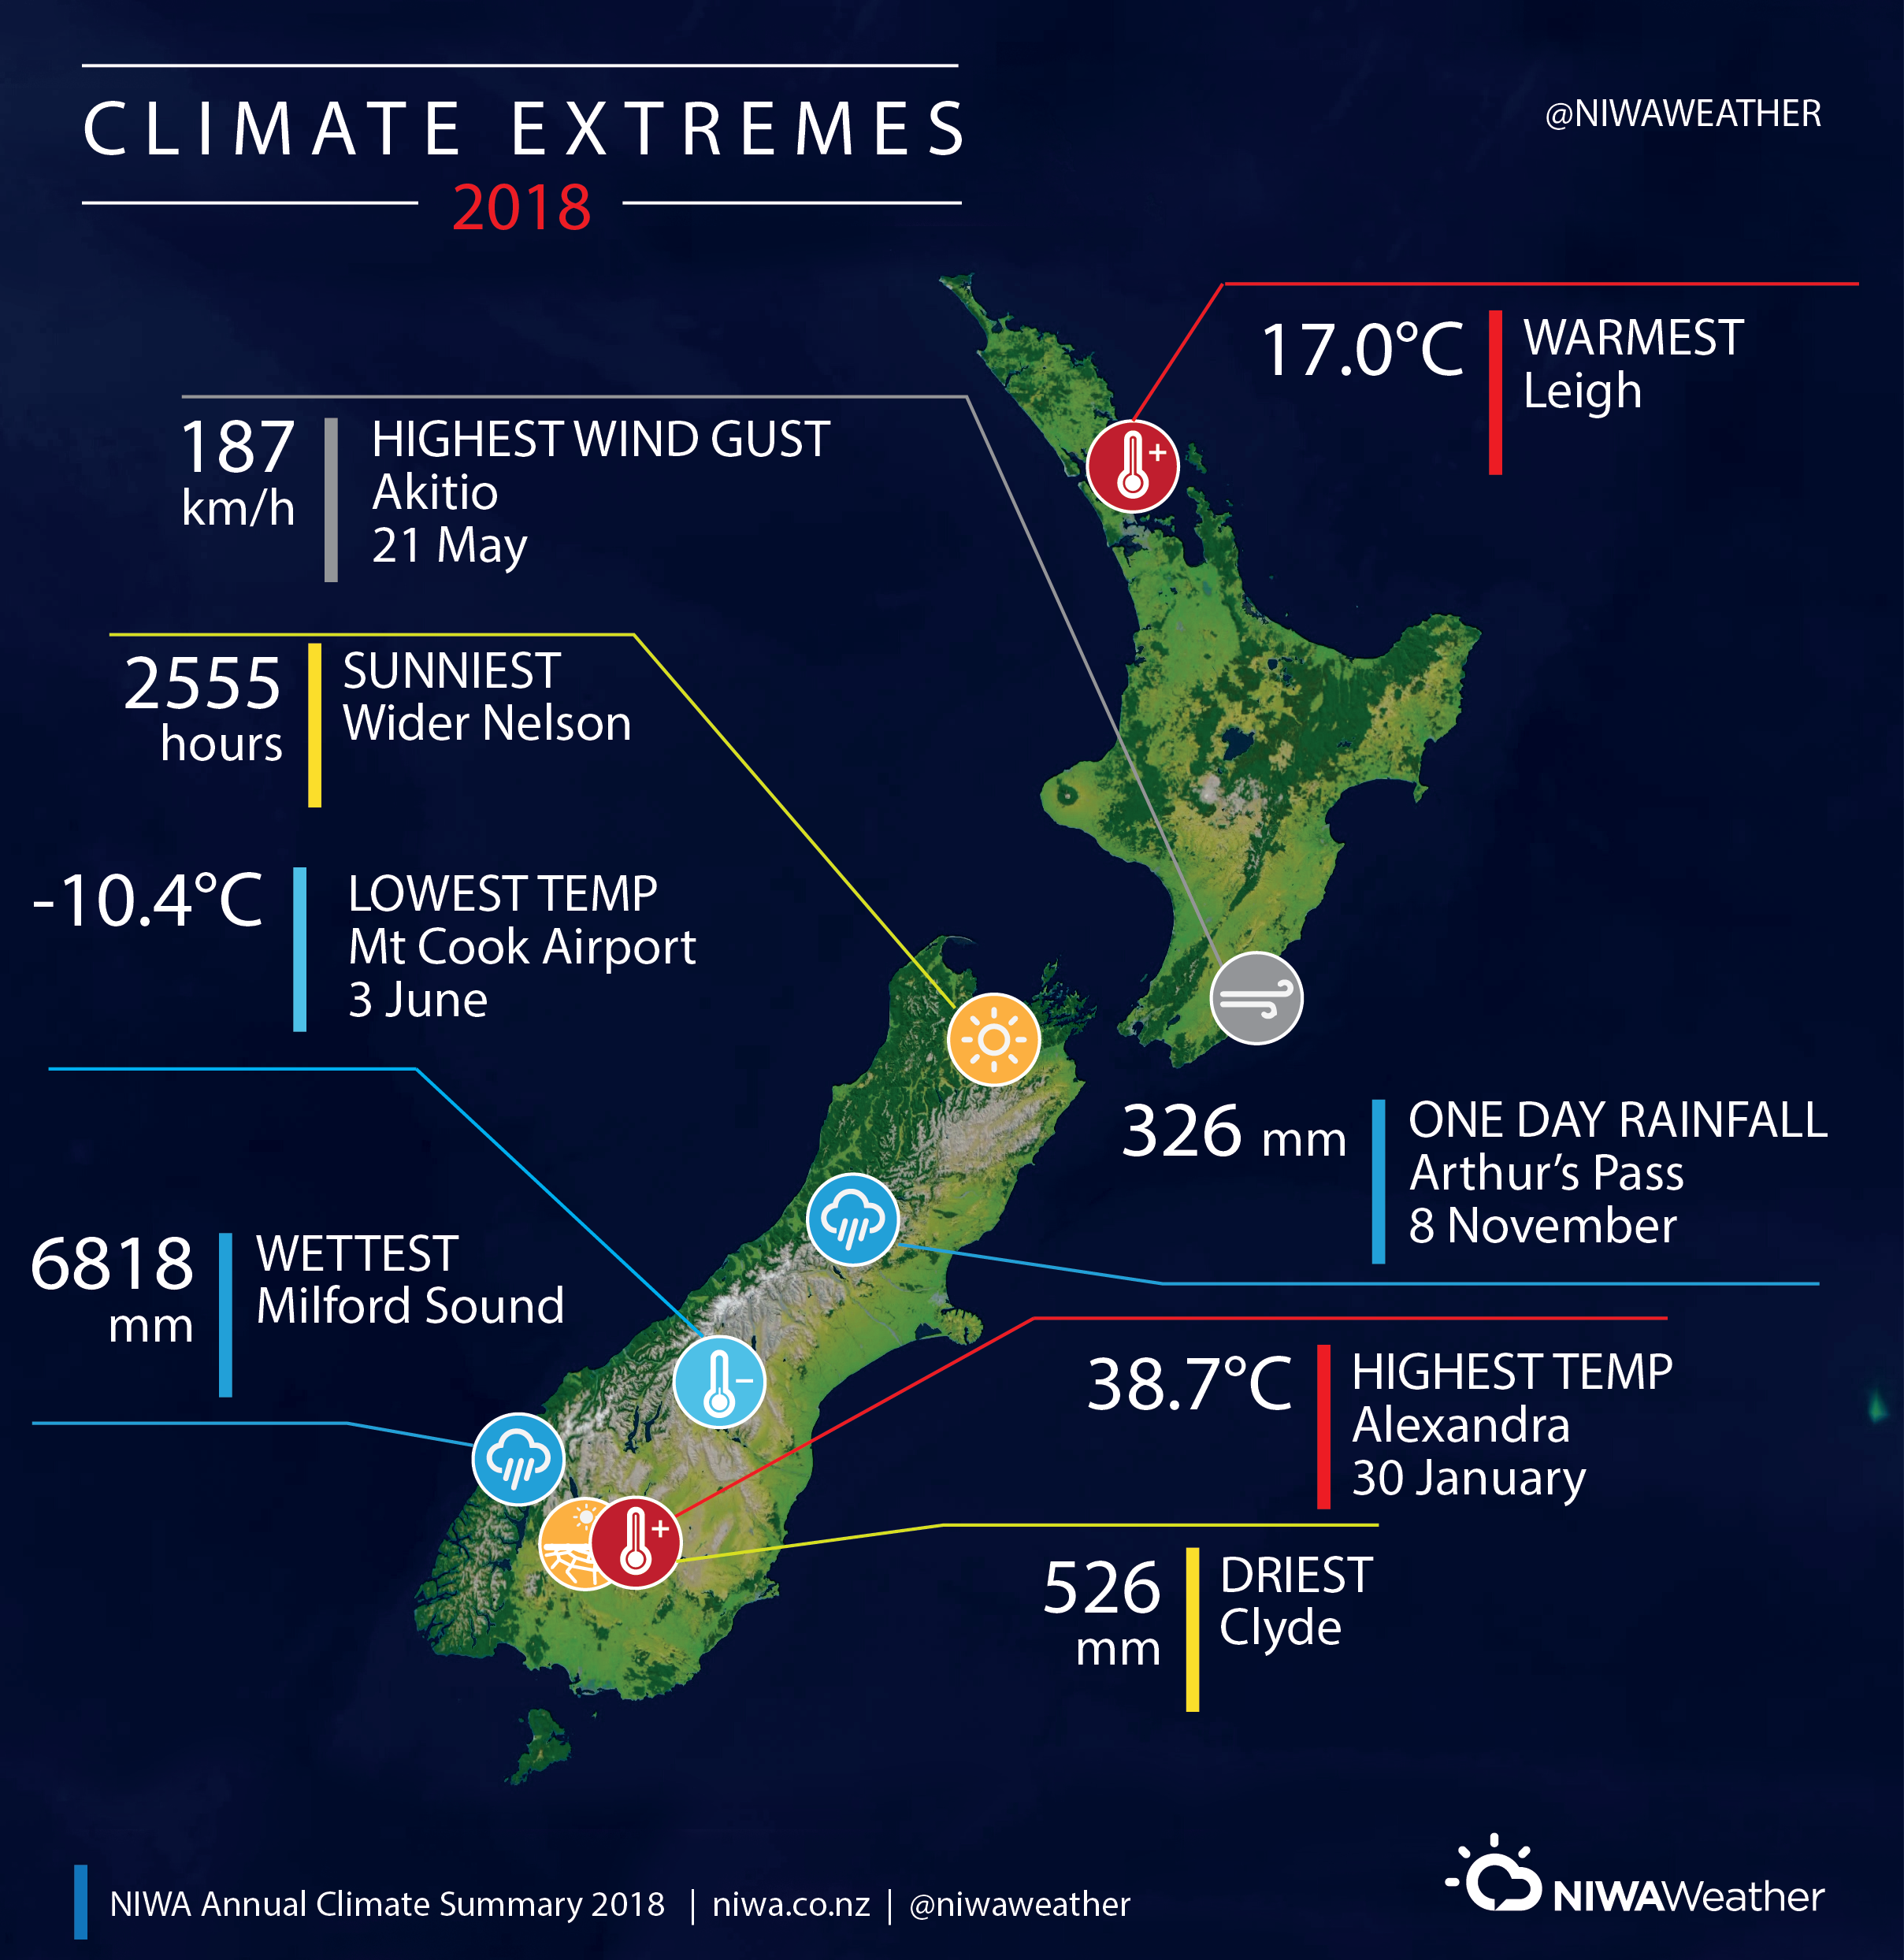
The wider Nelson region experienced New Zealand’s highest annual sunshine total during 2018 (2555 hours). |
Overview
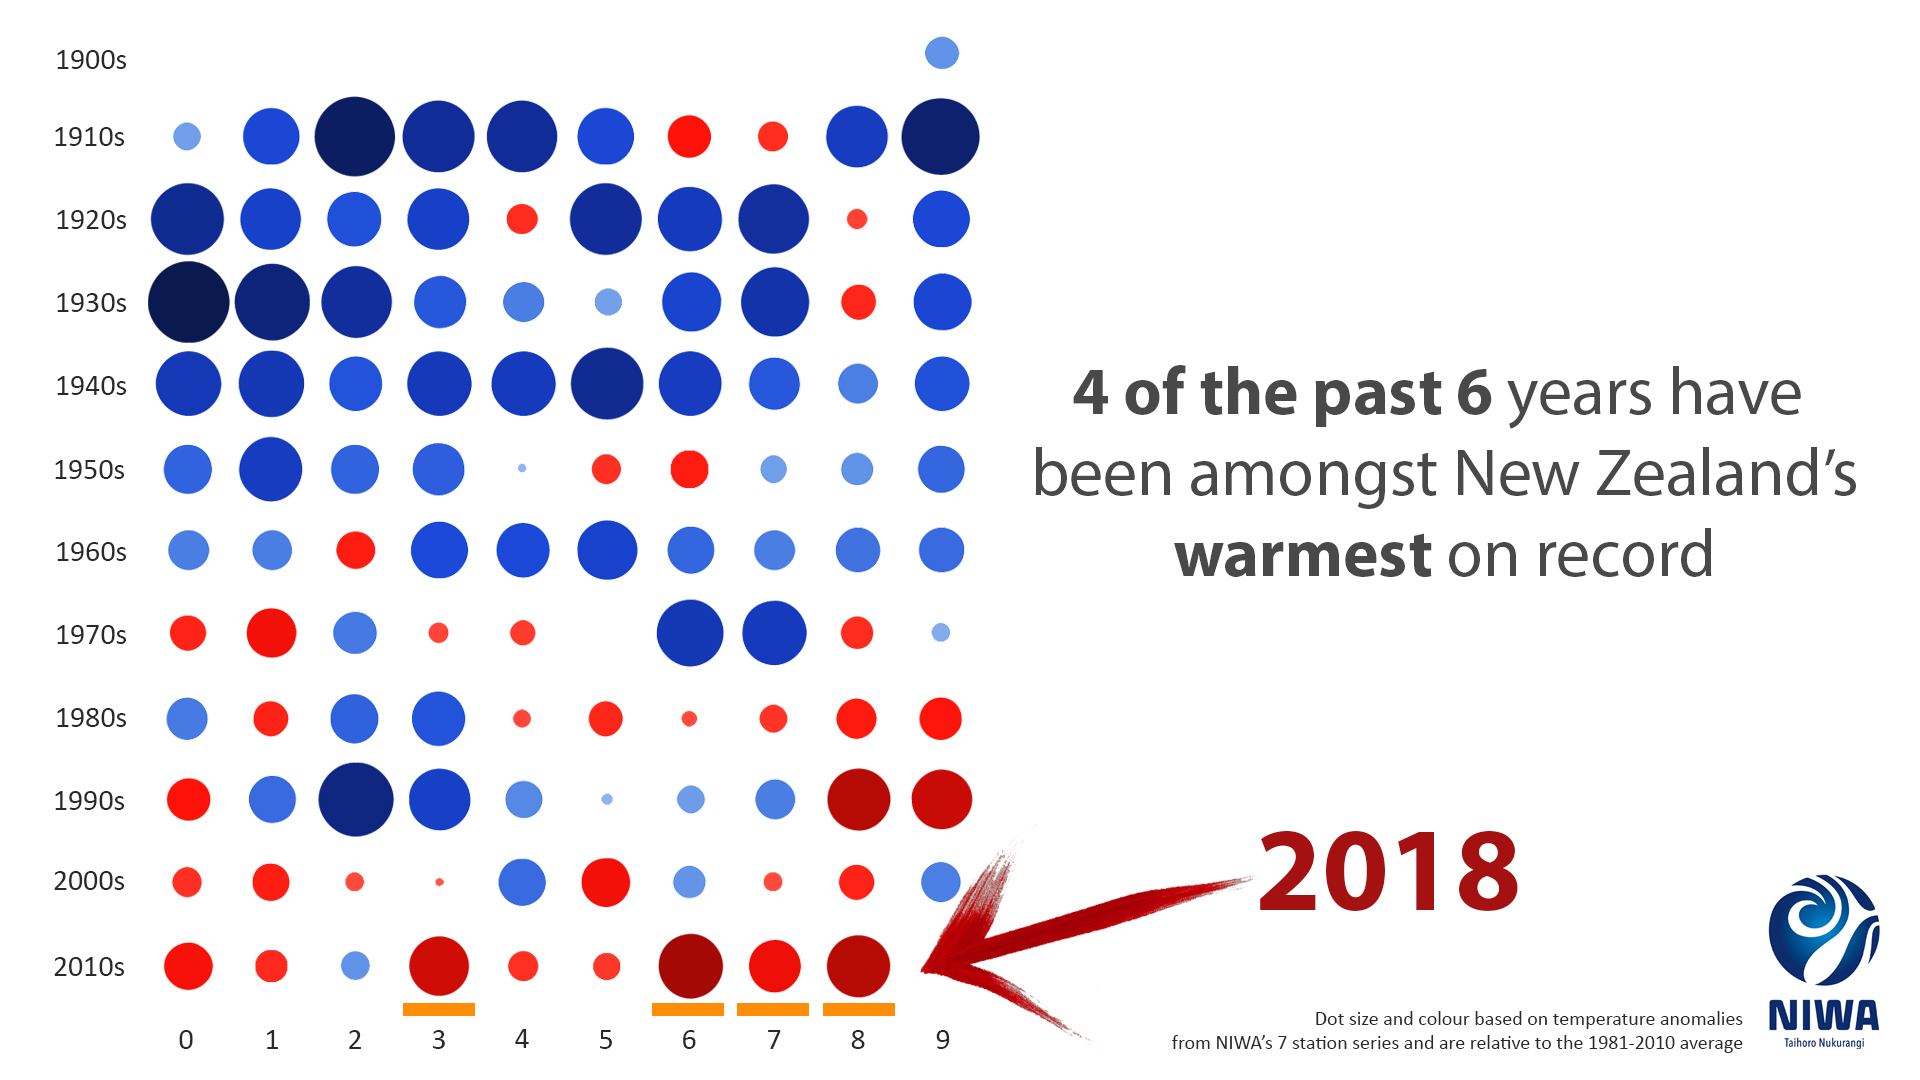
The nationwide average temperature for 2018, calculated using stations in NIWA’s seven-station temperature series which began in 1909, was 13.41°C (0.80°C above the 1981–2010 annual average). This makes 2018 the equal 2nd-warmest year on record along with 1998, only placing behind 2016 which had a nationwide average temperature of 13.45°C (0.84°C above the 1981–2010 annual average).
Annual mean sea level pressures for 2018 were slightly lower than normal over and just to the west of New Zealand, and higher than normal east of the country. This atmospheric pressure pattern produced slightly more northerly wind flows than normal for the year in the North Island, and more northeasterly to easterly wind flows in the South Island. This flow contributed to above normal to well above normal annual rainfall in parts of the eastern South Island.
Early 2018 featured more frequent warm northerly and northeasterly winds than normal, consistent with La Niña conditions.
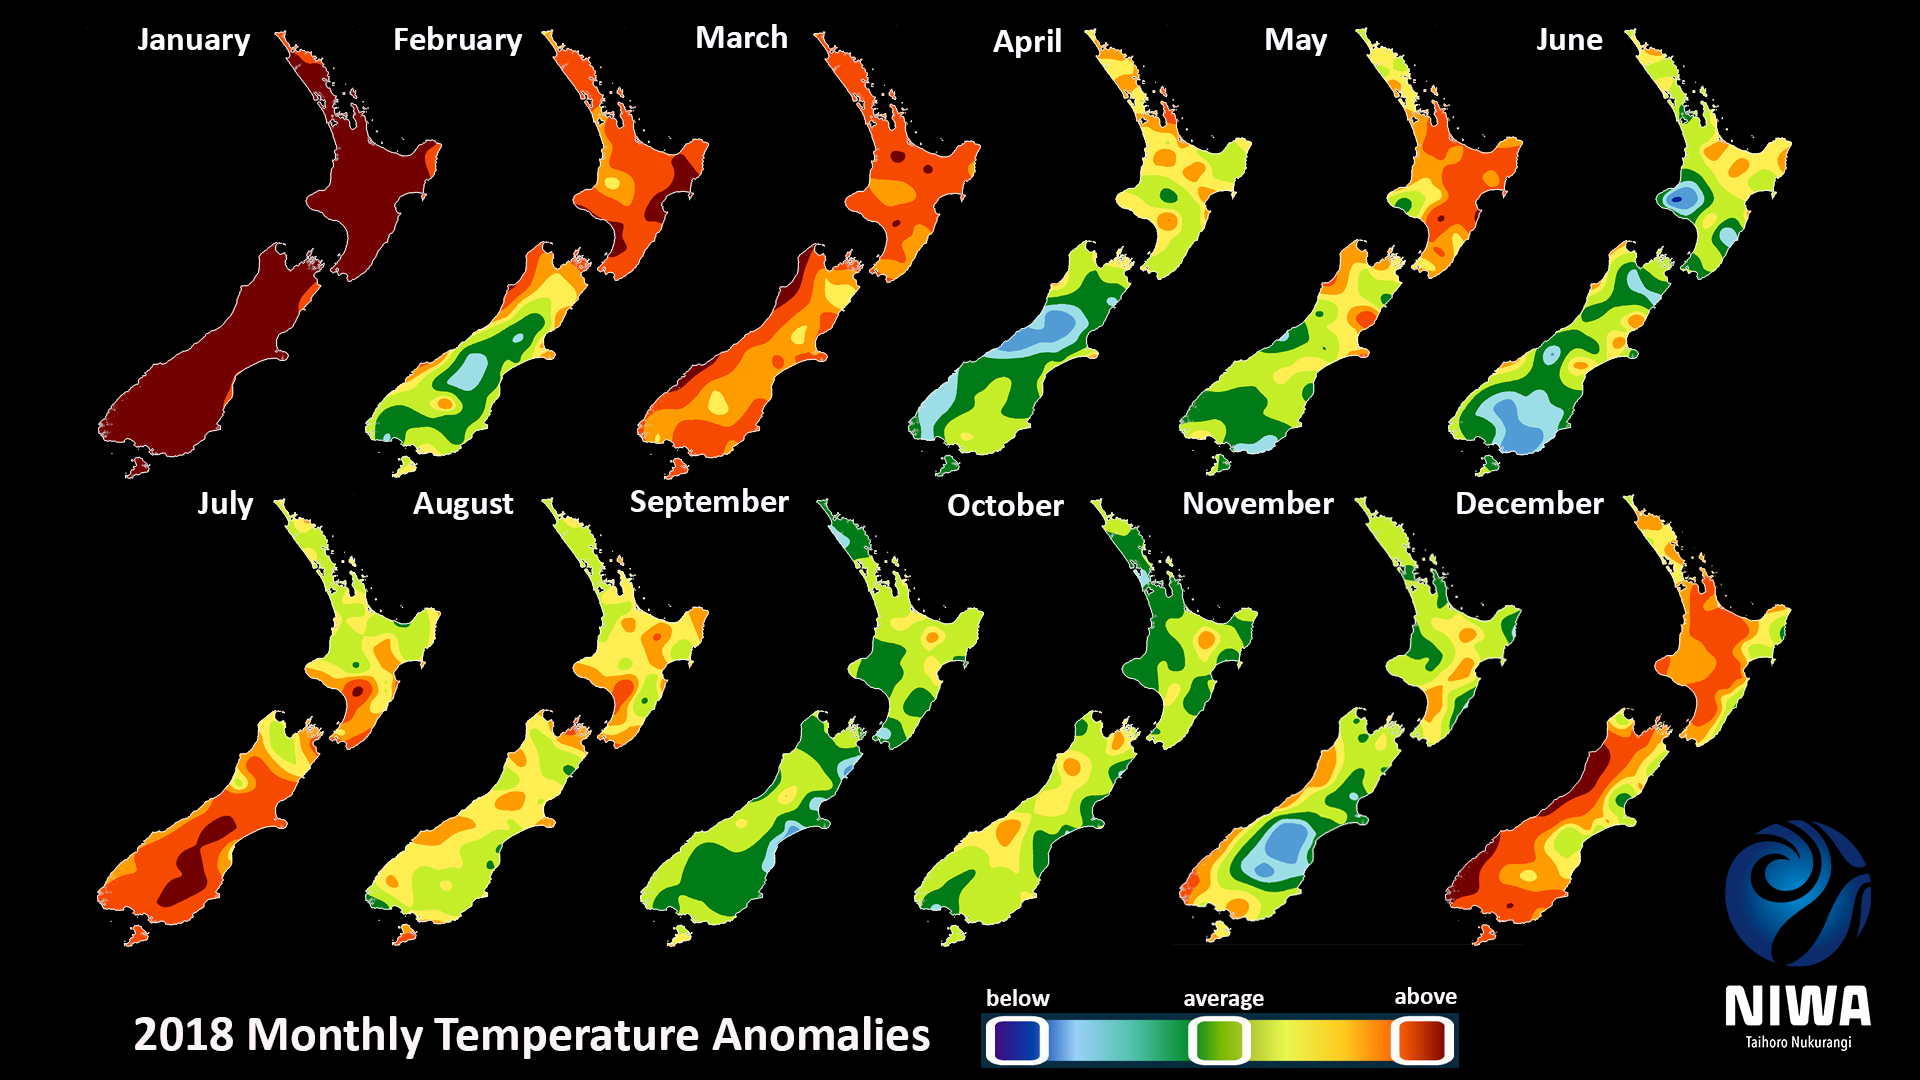
During 2018, temperatures were above average (+0.51°C to +1.20°C above the annual average) across the majority of New Zealand, including much of the North Island and the western and southern South Island. A small strip of well above average (>1.20°C from average) temperatures were observed in southern Manawatu-Whanganui. Elsewhere, near average (within -0.50°C to +0.50°C of average) temperatures occurred in parts of southern Canterbury, Otago, small parts of Auckland and the Far North. Many locations observed record or near-record high mean, mean maximum, and mean minimum temperatures.
For minimum temperatures, 2018 set a new warm record at 0.94°C above the 1981–2010 annual average, which exceeds the previous record minimum of +0.80°C held by the year 2016. Research has shown that historical warming rates have been larger for minimum temperatures compared with maximum temperatures, but temperature projections show inconsistencies – increasing diurnal range in some areas and decreasing in others [See Ministry for the Environment, 2018. Climate change projections for New Zealand].
Four of the past six years have been among New Zealand’s warmest on record.
2018 monthly temperatures started off with January recording a remarkable 3.1°C above the long-term average. With a mean temperature of 20.3°C, January 2018 surpassed February 1998 as the hottest month on record in New Zealand. January 2018 was the fourth month in the 21st century to have a nationwide temperature more than 2.0°C above average (after February 2016, May 2016 and December 2017). March and December were the other months to experience well above average temperatures (both 1.3°C above average). Three months, including February (0.8°C above average), July (1.1°C above average), and August (0.9°C above average) recorded above average temperatures. Meanwhile, six months, including April, May, June, September, October, and November had near average temperatures (-0.5°C to +0.5°C of the 1981–2010 monthly average).
Sea surface temperatures (SSTs) in the Tasman Sea and New Zealand coastal waters spiked to 2°C to 4°C above average beginning in November 2017 and persisted until February 2018. This was described as a “marine heatwave” due to its duration and intensity. Tasman Sea surface temperatures were their warmest on record during summer 2017-18, fuelled by higher than normal air pressure and light winds. For New Zealand, well above average SSTs drove unusually warm air temperatures, resulting in New Zealand’s hottest summer on record as well as its hottest single month on record (January 2018). (See Significant Weather and Climate Events in 2018 for further details).
The nationwide average temperature for summer 2017-18 was 18.8°C (2.1°C above the 1981-2010 summer average from NIWA’s seven station temperature series which began in 1909); the only summer on record to have a nationwide temperature more than 2.0°C above the 1981-2010 average. Thus, the summer of 2017-18 claimed the record of New Zealand’s hottest summer formerly held by the summer of 1934-35.
2018 began on a wet note for much of the North Island and upper South Island, although the lower South Island was quite dry in January. Ex-Tropical Cyclones Fehi and Gita brought well above normal rainfall to much of New Zealand in February. During Gita on 20 February, 148.4 mm of rain was recorded in Motueka-Riwaka between 4:00 am and 6:00 pm, or 173% of their February normal rainfall in just 14 hours. Between 4:00 am on 20 February and 10:00 am on 21 February, 202.0 mm of rain was recorded in Kaikoura. That amount is nearly four times the monthly normal there, 28% of the annual normal rainfall, and was more rain in less than 24 hours than had fallen in November 2017, December 2017, and January 2018 combined.
Autumn remained generally wetter than normal in the east of both islands, while on 28-29 April, Rotorua received 167.8 mm of rainfall over a 36-hour period, which is almost 1.5 times its normal rainfall for all of April.
During spring, easterly wind flows brought wetter than normal conditions back to the eastern South Island, particularly in November when widespread heavy rainfall was observed. It was extremely wet in Otago, where Oamaru, Middlemarch, Cromwell, and Lauder all observed their wettest spring on record. Conversely, several Auckland locations observed their driest spring on record, including Albany (North Shore) and Western Springs (MOTAT).
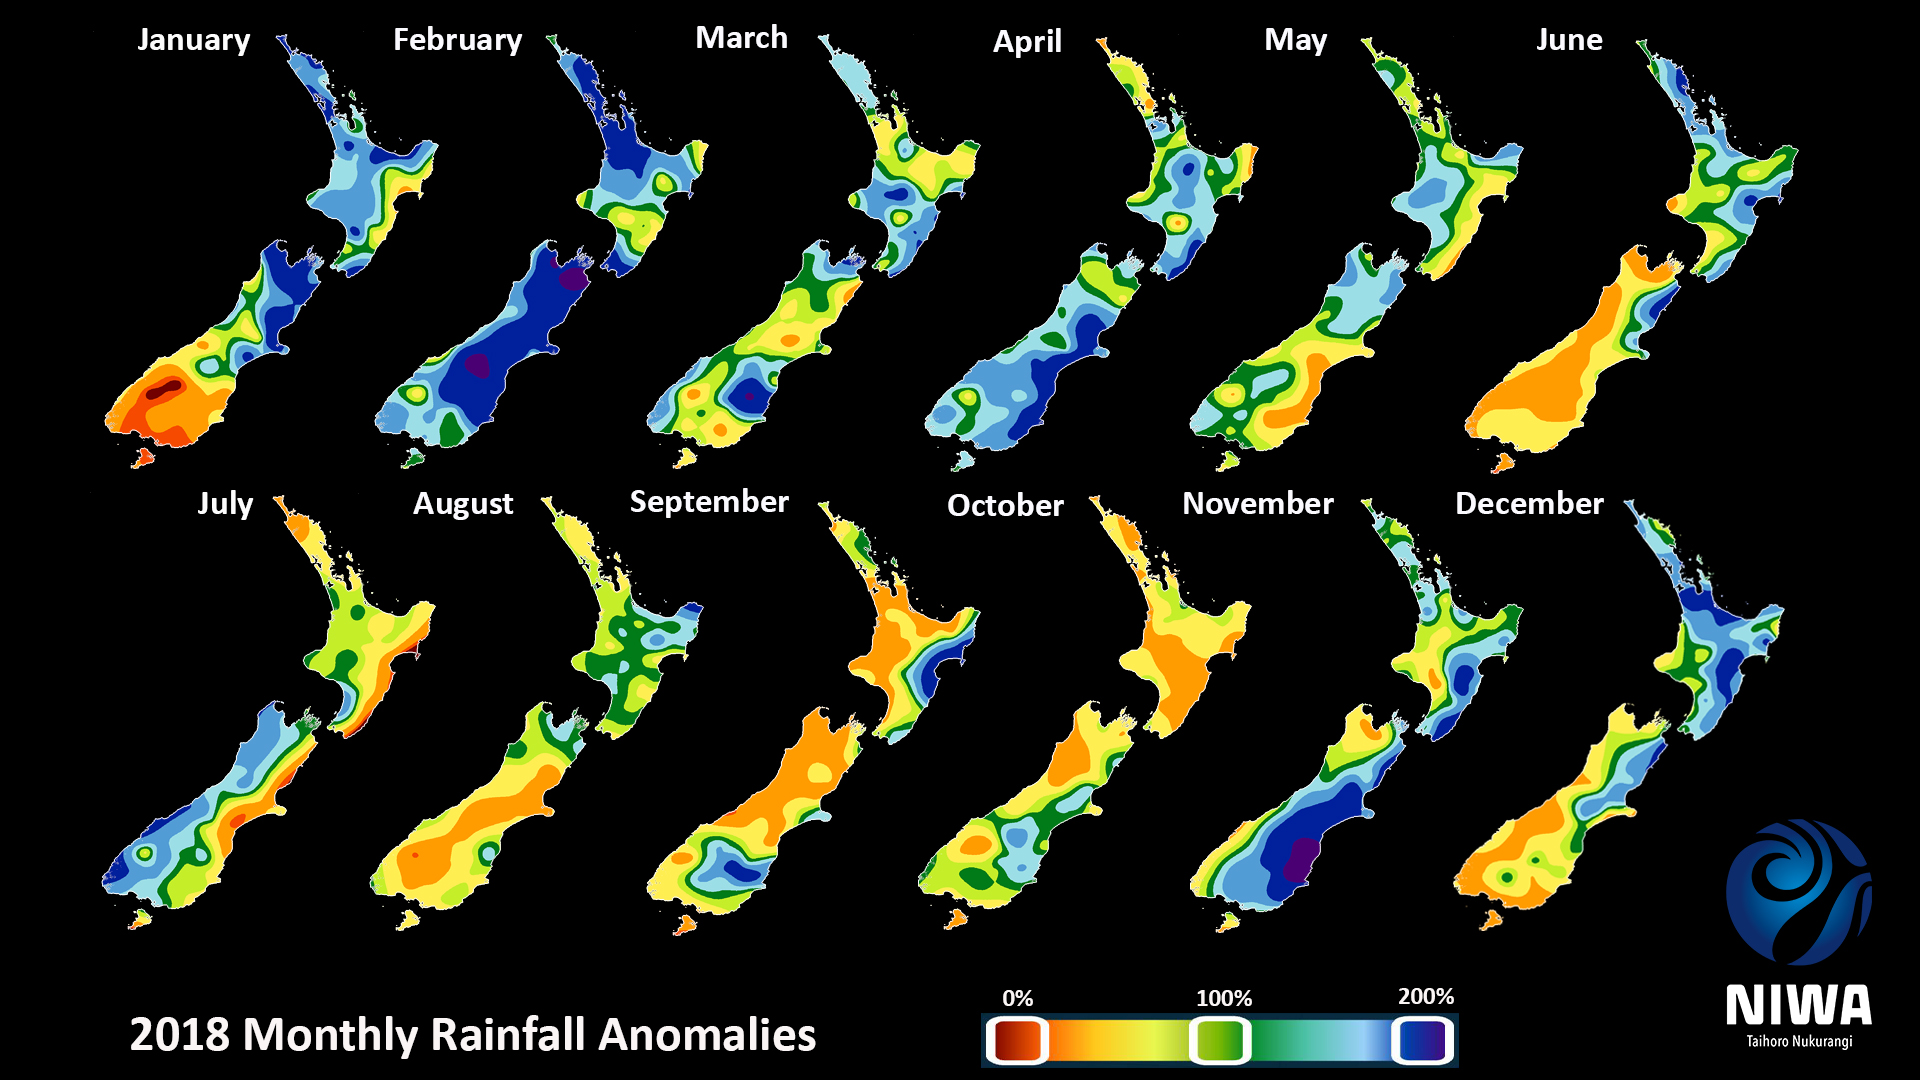
Yearly rainfall in 2018 was above normal (120-149% of the annual normal) across much of the eastern and upper South Island, as well as parts of Wellington, Wairarapa, Bay of Plenty, northern Waikato, and Auckland. Well above normal rainfall (>149% of normal) was observed in portions of southern Canterbury. Rainfall was near normal (80-119% of normal) for the remainder of New Zealand.
Soil moisture levels were below or well below normal to start 2018. Prolonged dry conditions prompted the Ministry of Primary Industries to declare a medium-scale adverse event for the Grey and Buller districts on 10 January. This classification was extended to include Otago and Southland on 30 January. Widespread heavy rainfall from ex-Tropical Cyclones Fehi and Gita during February resulted in well above normal soil moisture across most of New Zealand. Near or above normal soil moisture persisted through autumn, with near normal soil moisture during the winter. During the spring, soils became drier than normal in much of the country, although remained wetter than normal in southern Canterbury and Otago. On 24 October, water restrictions were initiated in Masterton due to low spring rainfall. Heavy rain in November brought widespread wetter than normal soils to the east of both islands, while a heavy rain event around Christmas did the same for the upper North Island.
The wider Nelson region experienced New Zealand’s highest annual sunshine total during 2018 (2555 hours), followed by Bay of Plenty (2518 hours) and Marlborough (2503 hours).
Download
Download the 2018 New Zealand Annual Climate Summary [PDF 1.6MB]
Contacts
For media comment, please contact:
Mr Chris Brandolino, Principal Scientist – Forecasting, NIWA National Climate Centre Tel. 09 375 6335, Mobile 027 886 0014
For climate data, please contact:
Mr Seth Carrier, Meteorologist, NIWA Auckland Tel. 09 375 4508
Note for editors
Climate measurements have been made in New Zealand for about 150 years, with reasonable coverage of reliable data from at least the early 1900s. NIWA makes its raw climate data publicly available for free on-line. Journalists are advised, however, to take extreme care when interpreting trends from raw data to ensure they have not been compromised by changes in site location, urbanisation, exposure, or instrumentation over time. If in any doubt, please call us.