-

The process
The process of coming to work with us has five steps: applying, a phone interview, a face to face interview, background checks, and an offer. -
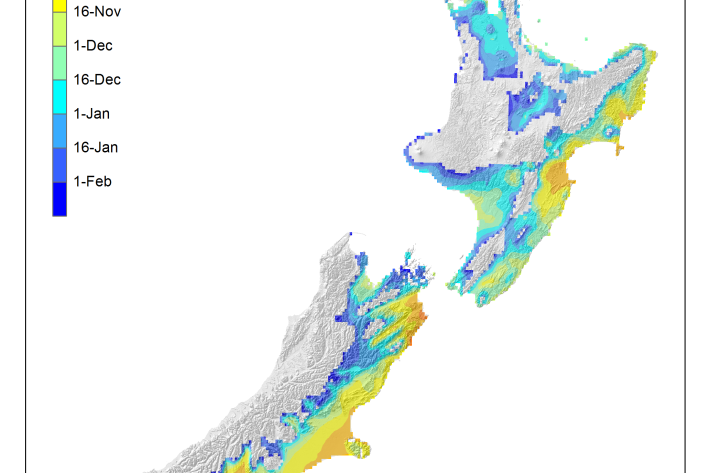
Average soil moisture deficit onset and termination maps
Maps of the average first and last dates of soil moisture deficit are shown here. -
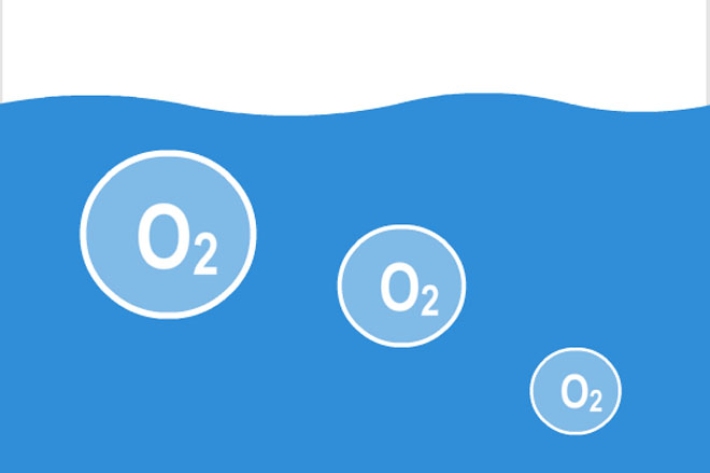
Dissolved oxygen
Dissolved oxygen (DO) is a relative measure of the amount of oxygen (O2) dissolved in water. -
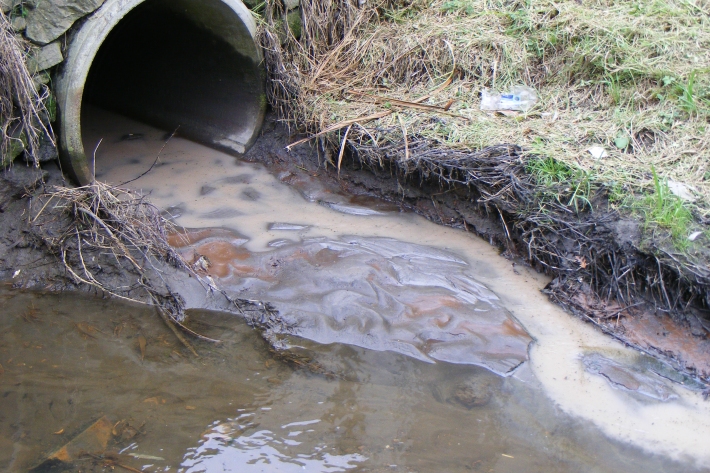
Instream barriers and altered water flow
Instream barriers and diversions alter the natural flow of rivers, streams, and lakes. -

Scholarships
Scholarships available to both Masters and undergraduate students in the fields of fisheries science and marine biology. -

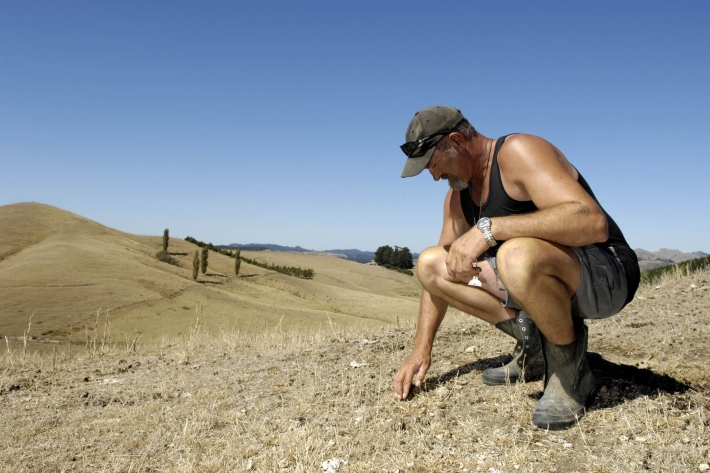
Dry stock farming activities
Dry stock farms can cover large areas of hill-country grassland that may be steep and prone to erosion. -
Daily climate maps
These climate maps are updated daily and are based on data from our National Climate Database. -

Graphing with Microsoft Excel
How do I create a graph?
Using Microsoft® Excel is easy because the Chart Wizard does all the work for you!
Simply enter the data for your data table.
Highlight the cells you want to graph.
Click on the Chart Wizard icon on the Tool Bar.
Select the chart type you want to use and click Next.
Click Next to confirm the range of cells.
Give your graph a title, label x- and y-axis and click Next.
Click on the gridlines tab to remove or add gridlines.
Click Finish and graph is complete!
Help, my graph is too small!
When the chart wizard creates your graph it will probably be too smal