If you happened to be in Timaru on February 6, 2011 you might recall it was uncomfortably, ridiculously hot.
It was Waitangi Day and Timaru’s temperature climbed steadily throughout the day until it got to a searing 41.3ᵒC.
“That’s wild,” says NIWA meteorologist Maria Augutis. “And hot for any part of the world.”
It also happened to be the fourth-highest hottest temperature ever recorded in New Zealand, and the hottest day of the last decade.
In the past 10 years, more weather records have been broken than in any other time in New Zealand’s history. Meanwhile, the World Meteorological Organisation says globally the last decade has been one of exceptional heat and almost certainly the hottest on record.
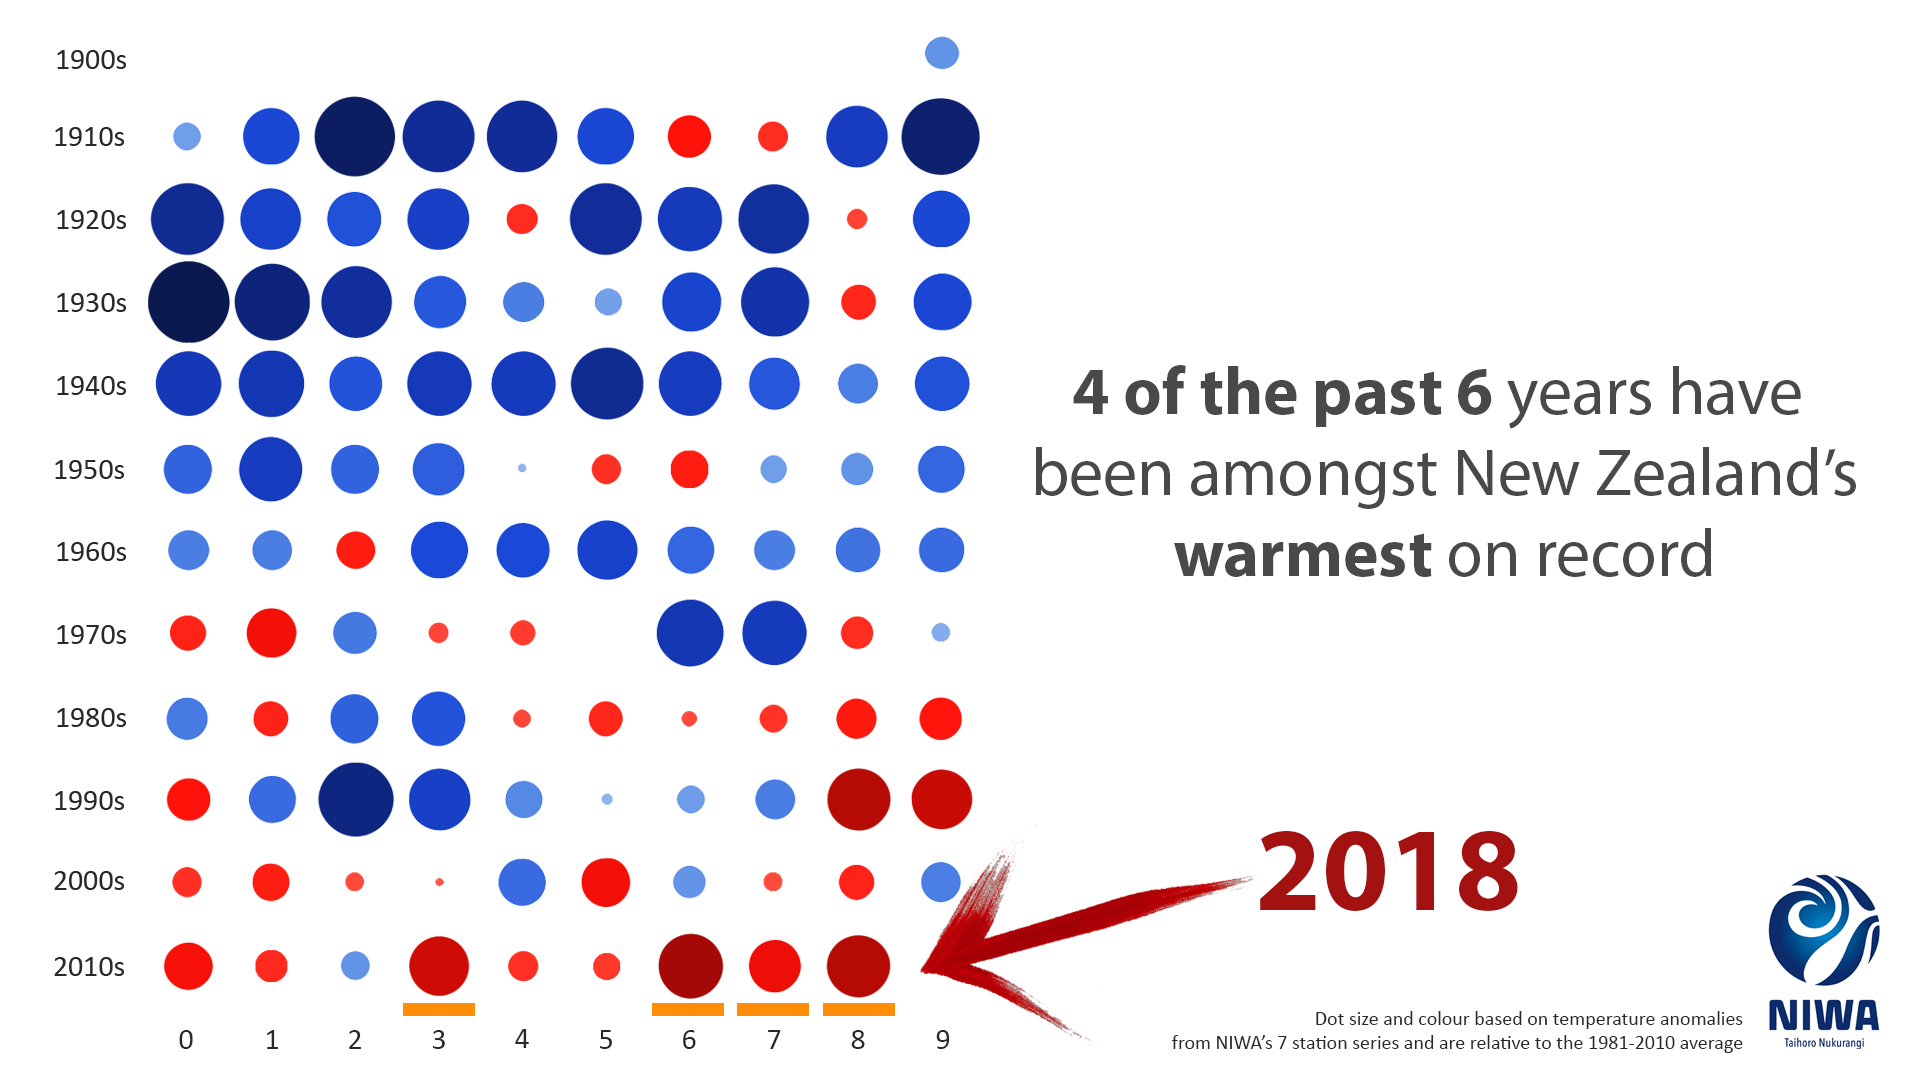
Mean annual temperature for New Zealand is calculated from NIWA's Seven Station Series which uses measurements derived from seven climate locations at Auckland, Masterton, Wellington, Hokitika, Nelson, Lincoln and Dunedin. The Seven Station Series dates back to 1909 and shows New Zealand’s average annual temperature has increased by about 1ᵒC over the past 100 years.
It also shows that five of the last 10 years have ranked somewhere in the top 10 warmest years on record – including 2016 which was New Zealand’s hottest year on record. This year, 2019, will join that list and almost certainly sit among the top five hottest.
Here’s how this decade ranks:
|
Year |
Anomaly (°C) |
Rank |
|
2016 |
+0.84 |
1st |
|
2018 |
+0.8 |
equal 2nd |
|
2013 |
+0.72 |
5th |
|
2017 |
+0.54 |
6th |
|
2010 |
+0.46 |
10th |
|
2011 |
+0.22 |
22nd |
|
2014 |
+0.18 |
equal 26th |
|
2015 |
+0.14 |
30th |
|
2012 |
-0.15 |
equal 44th |
|
2009 |
-0.32 |
equal 52nd |
Source: NIWA’s Seven Station Temperature Series which began in 1909
Examining and interpreting weather statistics is part of Augutis’ working day, but her fascination for the detail is shared by almost everyone.
“It’s because the weather impacts everyone’s life every day – you want to know if it’s hot, how hot? And if it feels like it’s been raining for longer than anyone can remember, you want to know if that’s true.”
Augutis’ fellow meteorologist Ben Noll says weather fanaticism is not just a New Zealand thing.
“Every country I’ve visited think they’re the most obsessed about the weather. It’s a thirst that can never be quenched. And it’s also a competition – Oamaru vs Timaru, Gisborne vs Hawke’s Bay. It’s a big thing, especially on social media.”
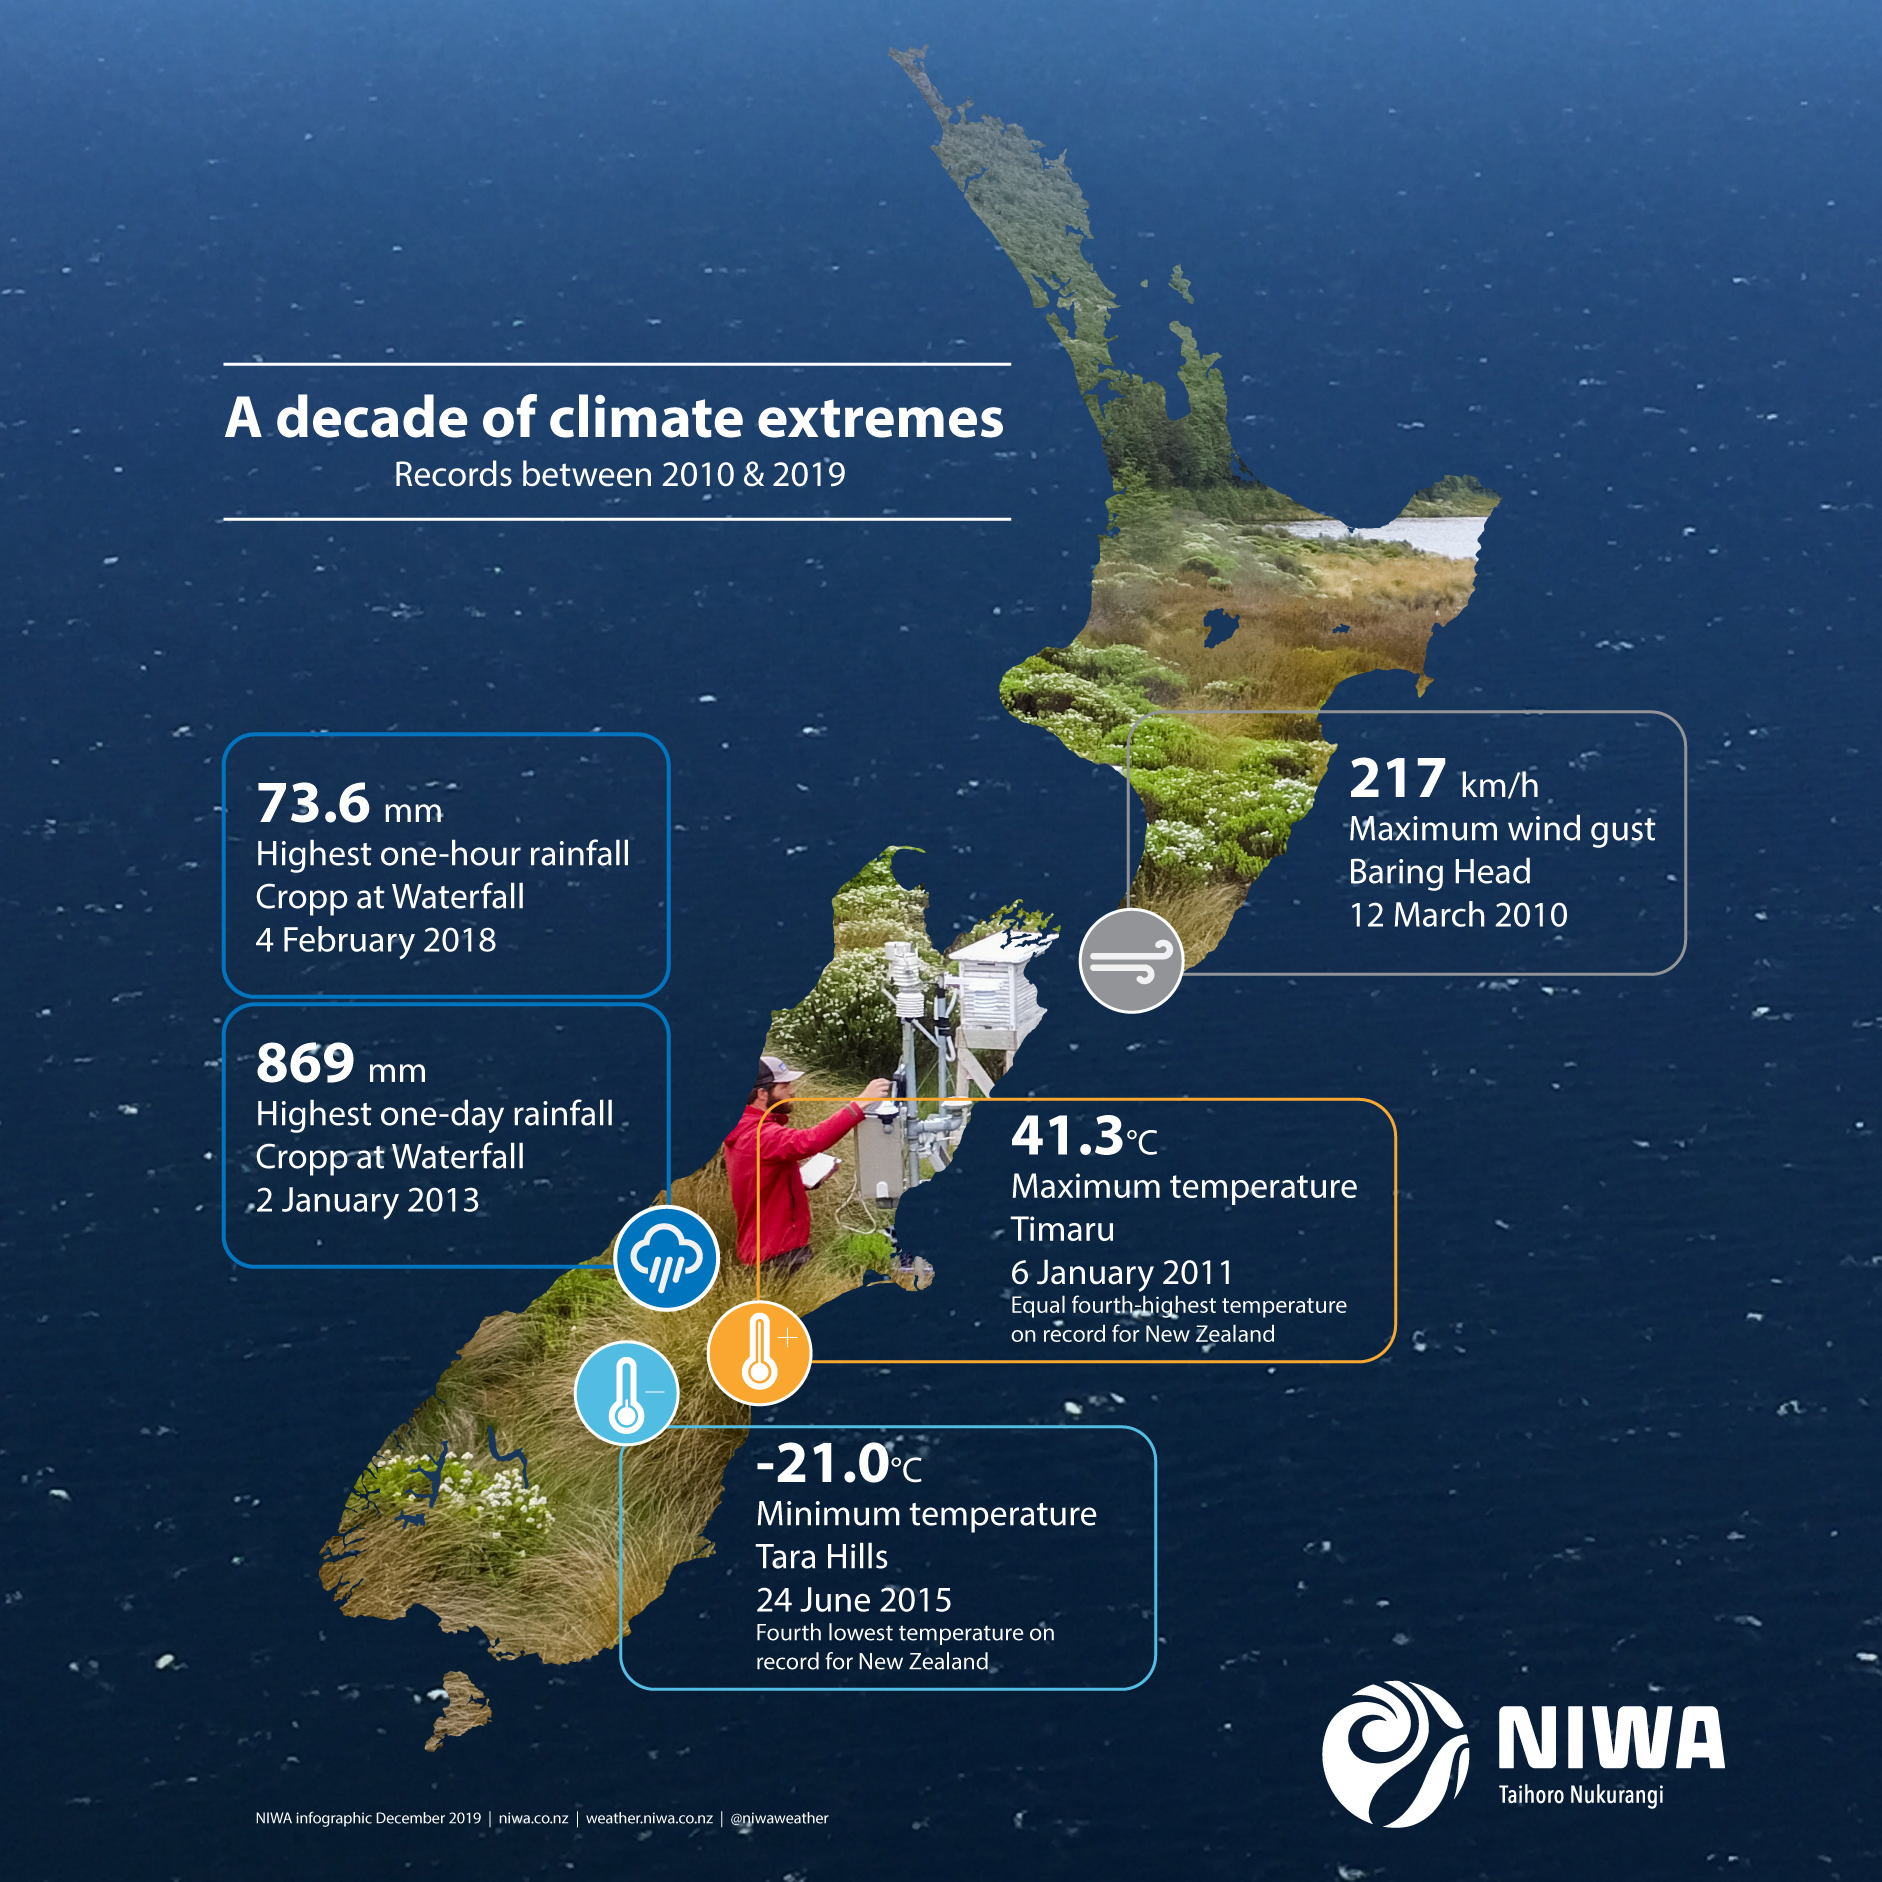
So with that in mind, NIWA has compiled the stand out weather statistics of the past 10 years:
- Maximum temperature: Timaru, 41.3°C on 6 February 2011. Equal fourth-highest temperature on record for New Zealand.
- Minimum temperature: Tara Hills -21.0°C on 24 June 2015. Fourth lowest temperature on record for New Zealand.
- Maximum wind gust: Baring Head, Wellington, 217 km/h on 12 March 2010
- Highest one-day rainfall: Cropp at Waterfall, 869 mm on 2 January 2013
- Highest one-hour rainfall: Cropp at Waterfall, 73.6 mm on 4 February 2018
- Maximum longest run of monthly mean temperatures above normal: Hicks Bay, 29 months from January 2017 to May 2019
- Highest average bright sunshine per day: Whakatane, average of 7.12 hours of bright sunshine (record length 3578 days)
- Sunniest single day: Gore, 15.3 hours of bright sunshine on 23 December 2018
- Highest average maximum daily temperature: Whangarei 20.36°C (record length 3620 days)
- Highest average mean daily temperature: Whangarei, 16.25°C (record length 3617 days)
- Highest average minimum daily temperature: Cape Reinga, 13.28°C (record length 3466 days)
- Lowest average maximum daily temperature: Takahe Valley (Southland), 9.61 °C (record length 3419 days)
- Lowest average mean daily temperature: Takahe Valley (Southland), 5.06 °C (record length 3449 days)
- Lowest average minimum daily temperature: Takahe Valley (Southland), 1.05 °C (record length 3419 days)
- Warmest sea surface temperature: west of Northland, 25.1˚C on 13 February 2019
- Largest positive sea surface temperature anomaly: coastal Canterbury, +6.9˚C above average on 9 December 2017
- Coolest sea surface temperature: east of Otago, 4.9˚C, 18 August 2018
- Largest negative SST anomaly: west of Chatham Island, -4.5˚C below average, 12 December 2015
So what’s the weather been like this year?
As usual, a little bit of everything. But for the record the hottest temperature was 38.4ᵒC at Hanmer Forest on January 31. The coldest temperature for 2019 was -9.2ᵒC at Lake Tekapo on June 3 and the wettest? That was Rings Beach, Coromandel Peninsula on September 9 which stood at 226mm when the day ended.
Note: NIWA will release its official Annual Climate Summary for 2019 at 11am on January 9.
This article forms part of our 2019 Summer Series. Read other stories in the series.