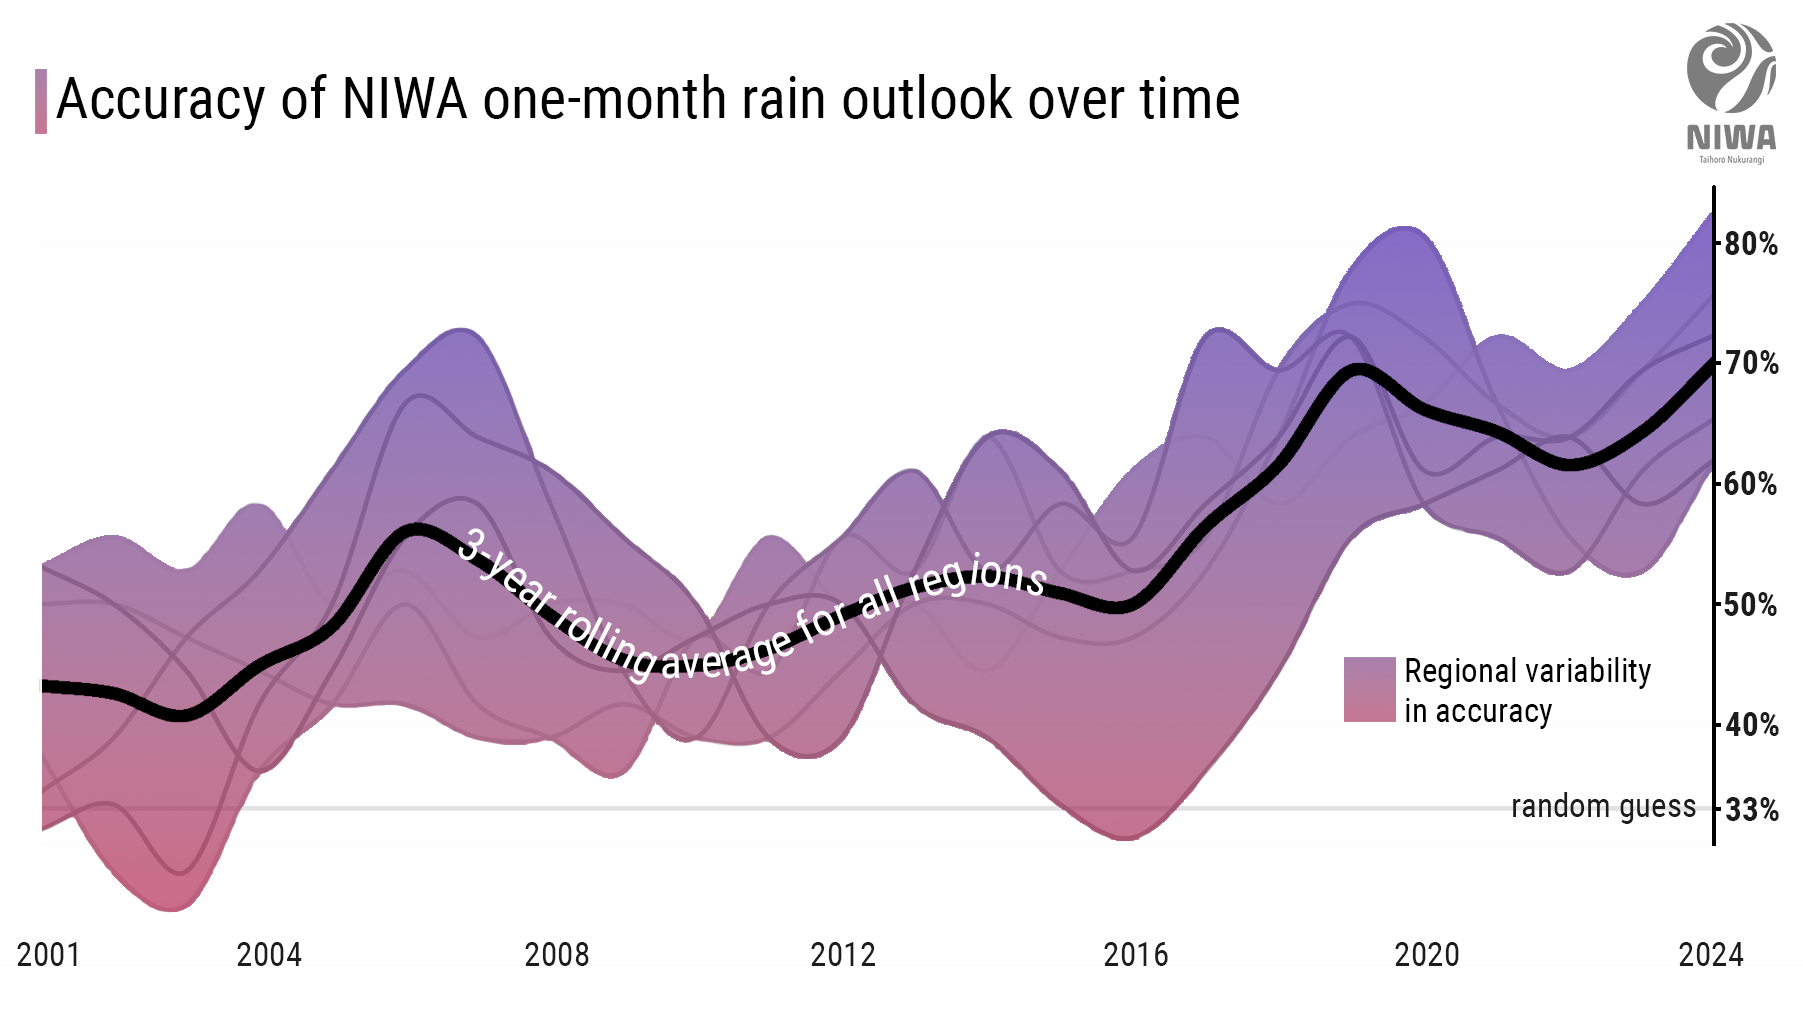
July 2024 marks a special anniversary for NIWA - 25 years of issuing our Seasonal Climate Outlook.
Humble beginnings
The Seasonal Climate Outlook (SCO) is one of NIWA’s most popular services. It provides temperature, rainfall, soil moisture and river flow predictions for Aotearoa for the coming three months.
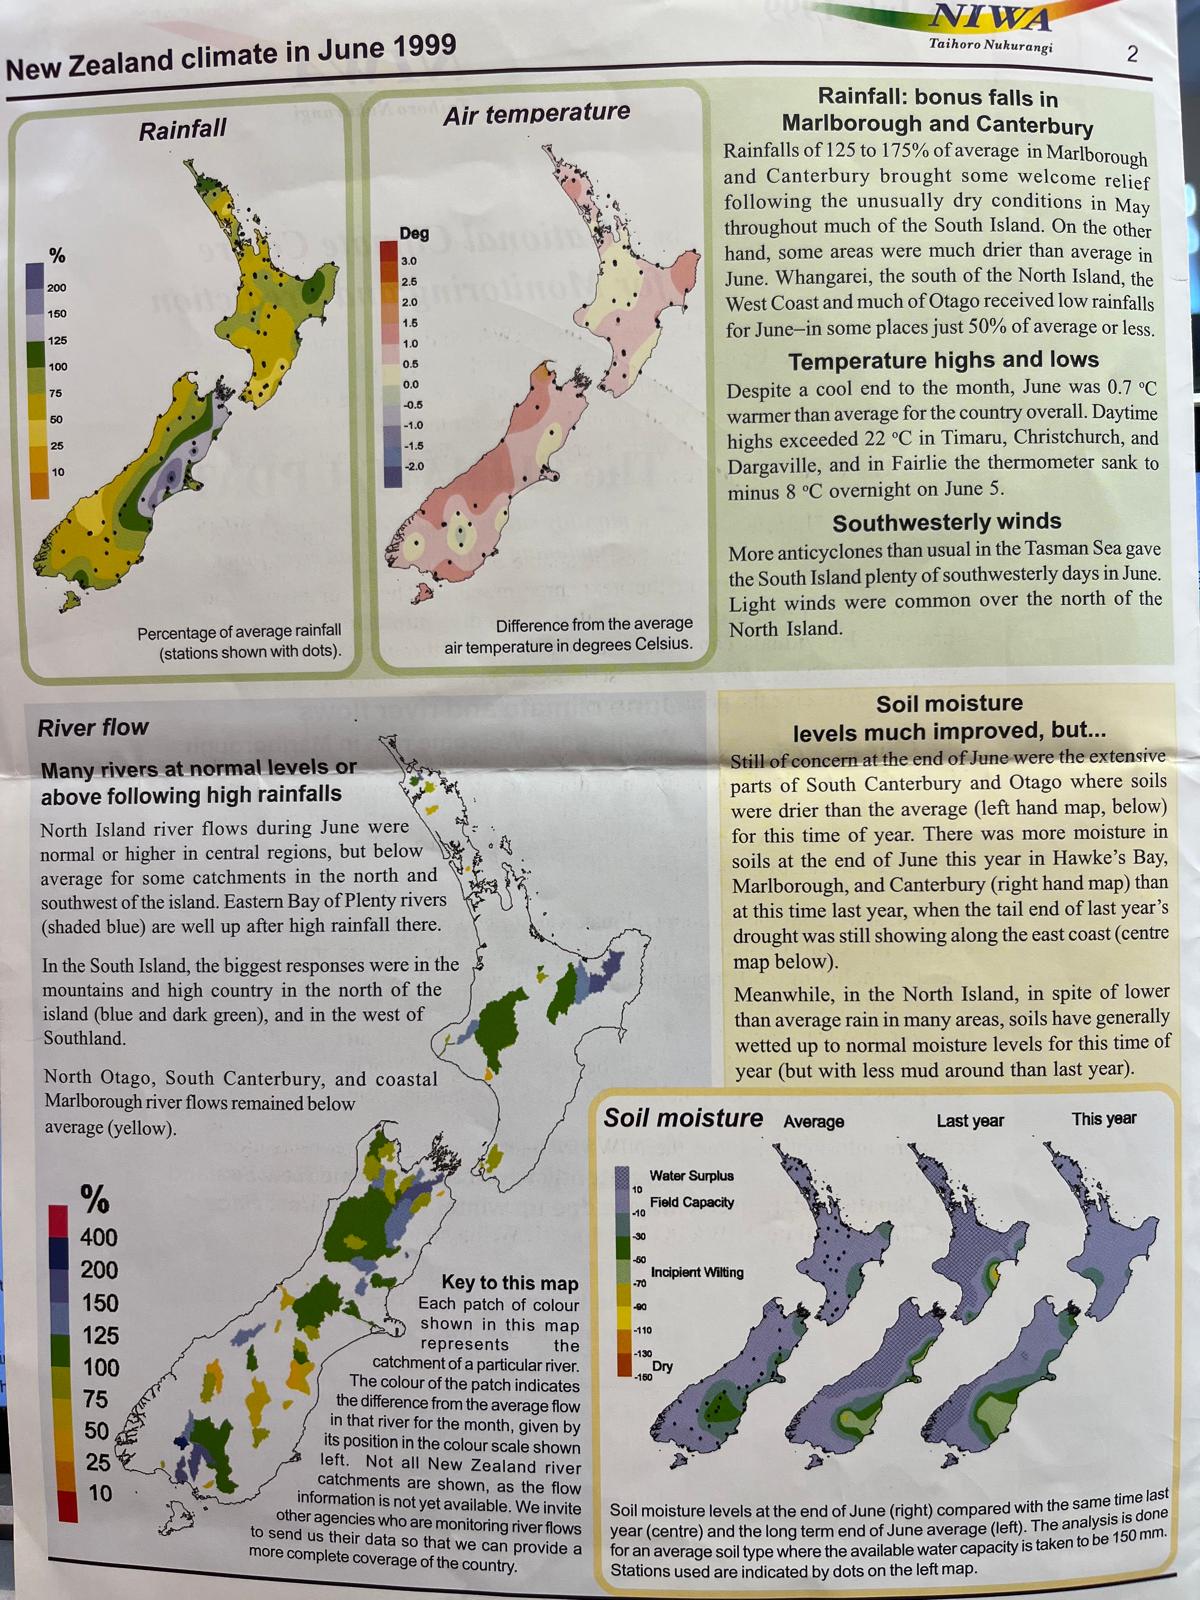
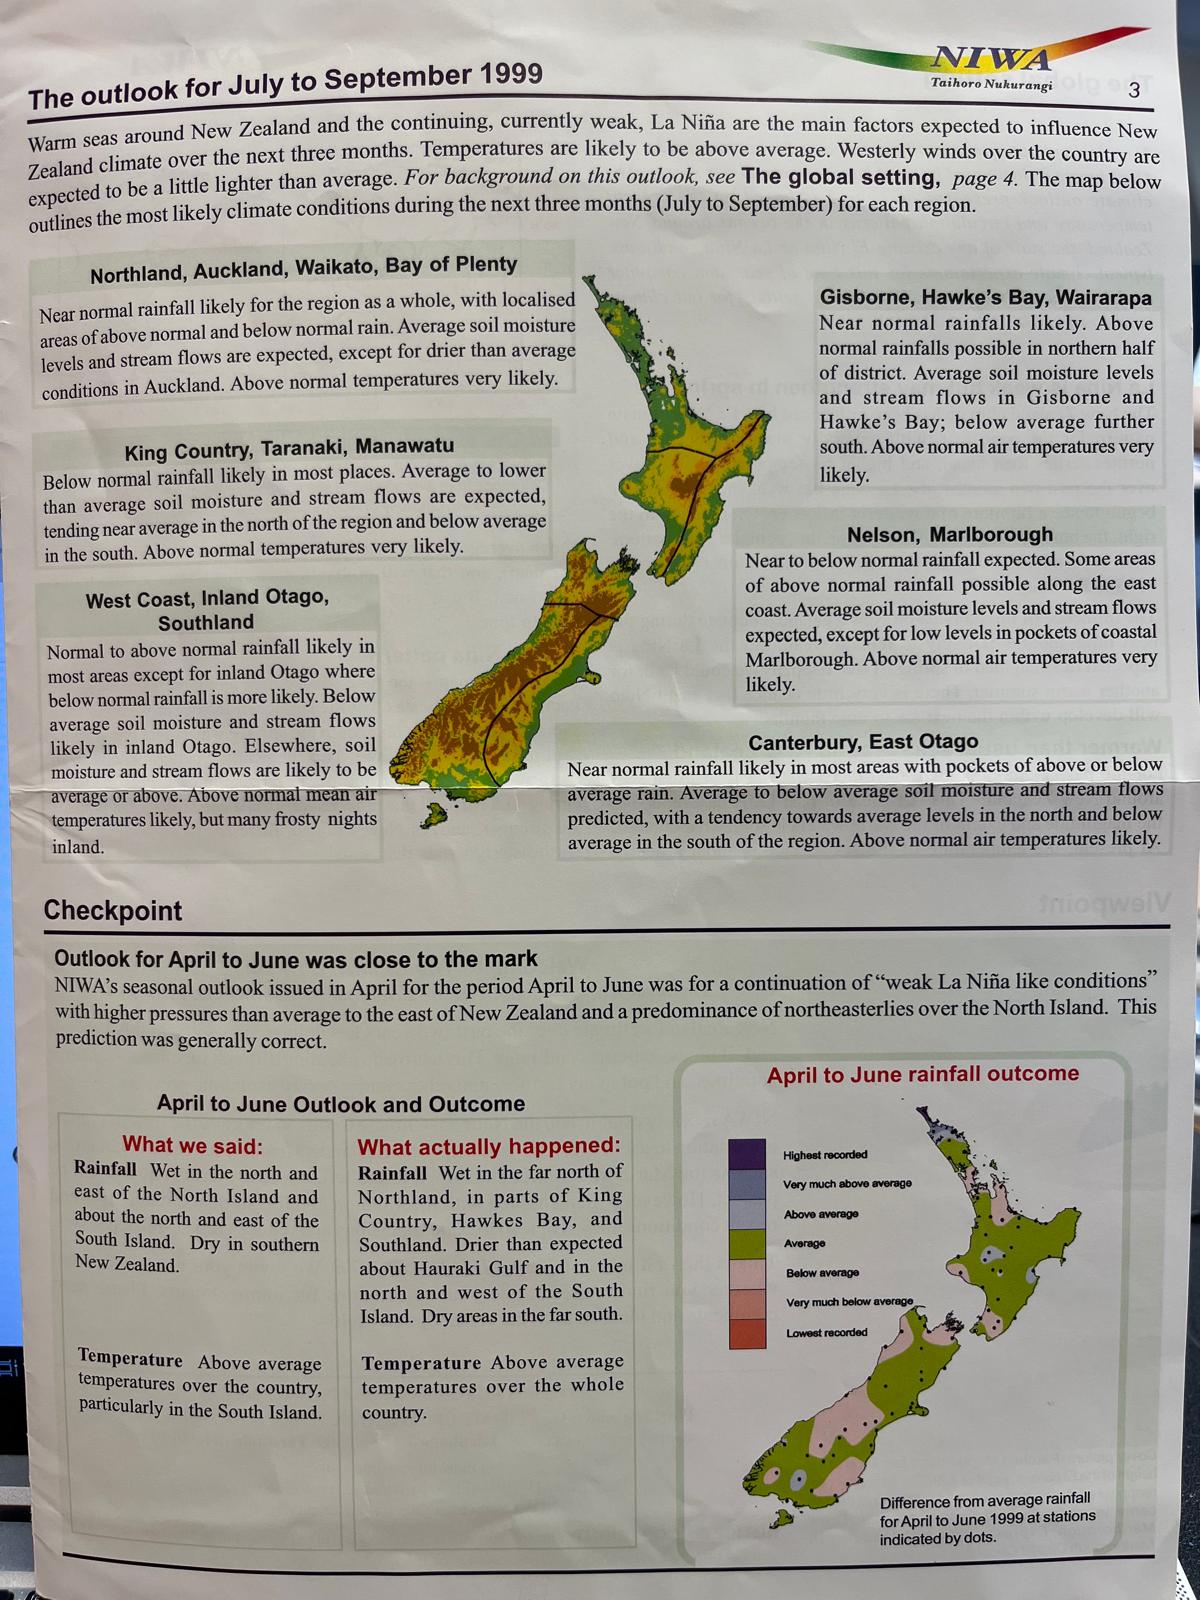
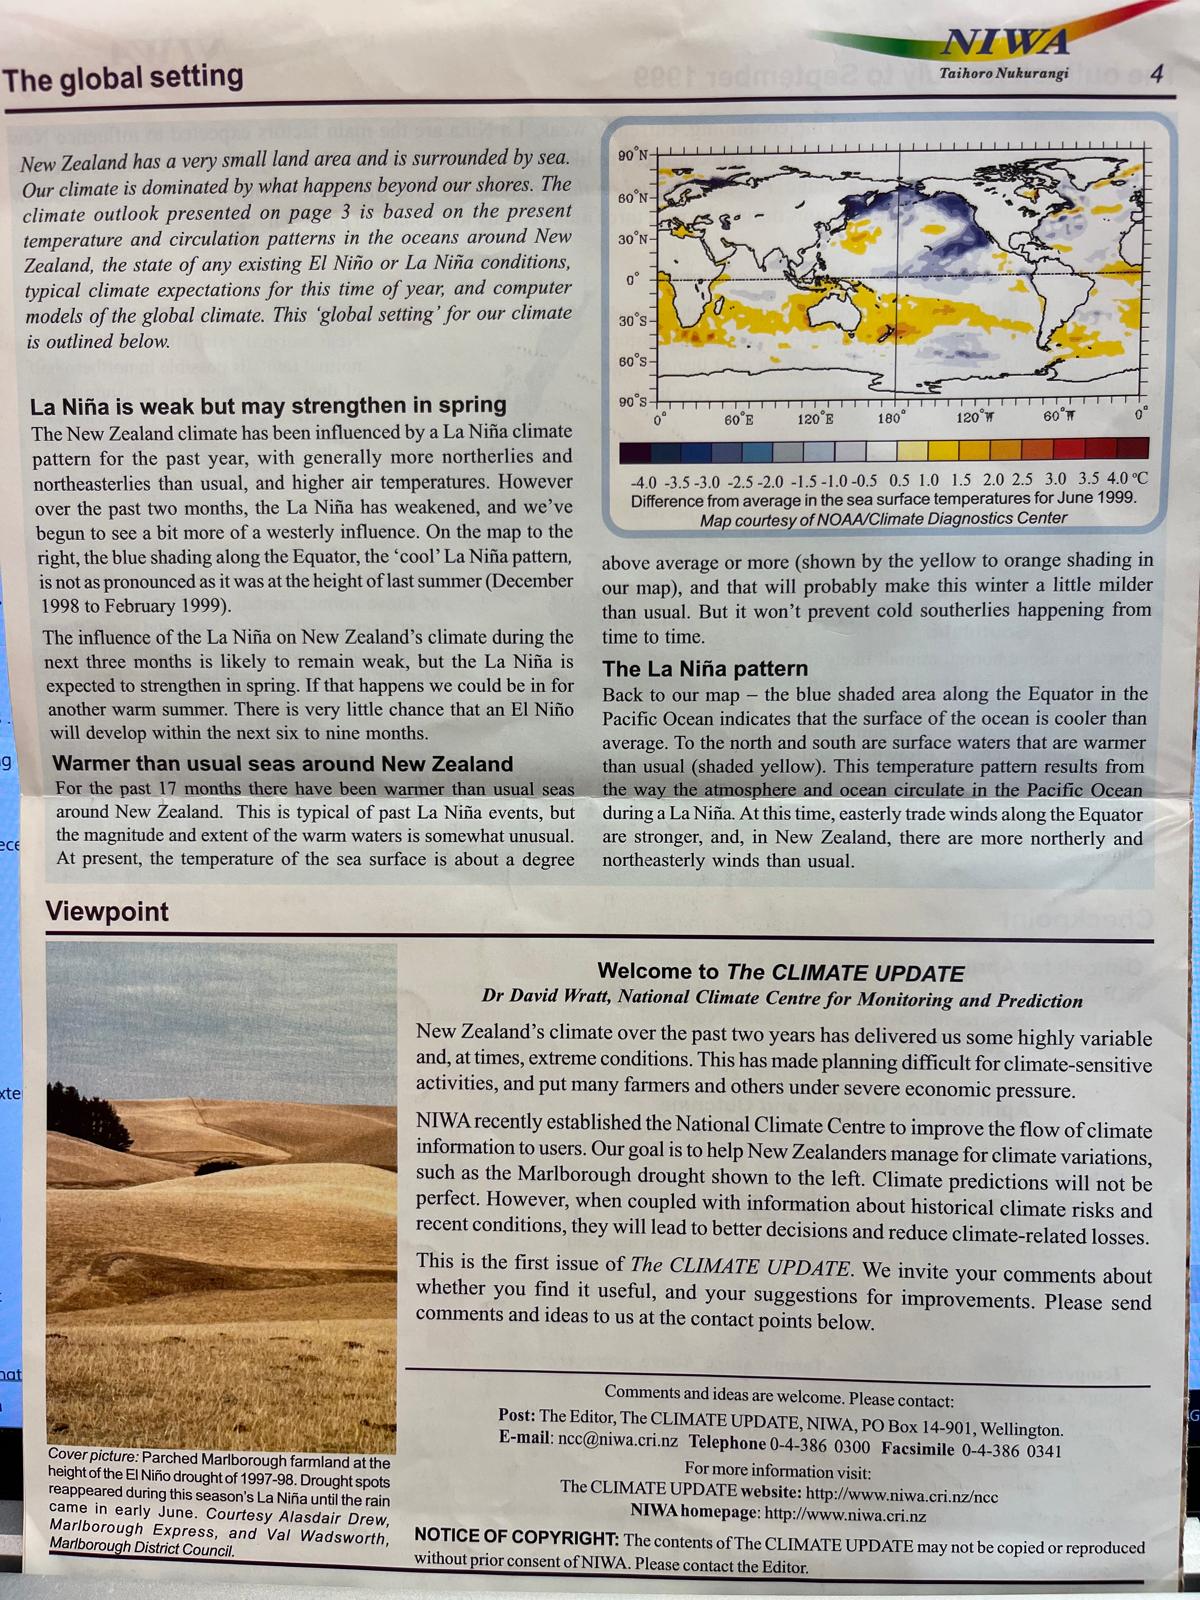
The first SCO was released in 1999, just before the turn of the millennium. This was when computers still used dial-up internet and the first mobile phone with digital camera (at a measly 0.11 megapixels) wouldn’t be sold until the following year.
NIWA’s Chief Scientist for Climate, Atmosphere and Hazards Dr Andrew Tait says our methods to create the original SCOs were quite old-school.
“Computers were starting to become the mainstream way of interpreting data from ground-based measurements and satellites. But it was a transition period; sharing between worldwide climate centres was not common, and much of the modelling was still done by hand.
“We’d sit in our respective offices and dial in using an old teleconference phone to share our scribbles. We’d look at what happened during similar conditions in the past and interpret the results. Then, by spoken consensus, would agree upon our predictions for the climate of New Zealand in the coming months”, said Dr Tait.

Back then, those predictions were published on a 4-page leaflet that was sent by post to the media and anyone else who wanted to subscribe.

Today, the SCO is accessed online and generally covers more than 4 pages. It is also supported by an extensive code base, running on NIWA’s powerful supercomputer that can perform up to 1.4 trillion calculations per second. It is also a lot more objective, with data collated from more than 9 general circulation models (GCMs) worldwide and aggregated and tailored for Aotearoa New Zealand.
But it still is, as it was in the olden days published every month.
It’s a little complicated…
So, what does the SCO tell us?
SCOs are not weather forecasts. Weather forecasts are highly accurate, real-time updates of the weather for a short-time period – think: do I need to take my umbrella to the park tomorrow?
However, it is not possible to predict daily weather variations months in advance for specific locations. Therefore, SCOs are a statistical summary of the average weather conditions expected over a three-month period – think: what are the chances my heating bill is going to cost more because it will be a colder winter than last year?
Specifically, NIWA’s SCO gives percentage-based regional guidance on rainfall, air temperature, soil moisture, and river flows expected over the next three months. The country is divided into six regions based on geography and similarities in their long-term climate: the north, west, and east of the North Island and the north, west, and east of the South Island – guidance is provided for each region.

NIWA meteorologist Ben Noll says this general and probabilistic information is given due to the chaotic, non-linear nature of the atmosphere and the longer timescales used.
“For an SCO, forecasters make predictions based on climate drivers, which are features that steer the wheel of Mother Nature’s car. These include El Niño and La Niña, which many Kiwis will be familiar with, the Southern Annular Mode, regional sea surface temperatures, and lesser-known influences like the Madden-Julian Oscillation,” said Mr Noll.
The climate drivers can “nudge” the system in different ways. A marine heatwave, for example, can increase the chances for above average air temperatures. A La Niña can increase the chance for above normal rainfall in the north and east of the North Island.
“Due to New Zealand being surrounded by vast oceans, La Niña/El Niño has always been a focus of the SCO. Although this climate driver occurs over 5000 km away in the equatorial Pacific Ocean, it can shift patterns of rainfall and thunderstorm activity which has flow-on effects for areas of high and low pressure nearer to New Zealand,” said Mr Noll.
The process to create their SCO predictions is a complicated one, taking lots of time, care and thought. Climate drivers have varying lifespans, intensities, and effects, meaning forecasters are in the unenvious position of trying to decipher when and how they will interact and must deal with the fact that no two climate driver interactions are the same.
Blame it on the weather man
Communicating the SCO has always been vital to NIWA – disseminating the information in a clear and engaging way improves trust and facilitates informed, appropriate decision making.
These days, our meteorologists take advantage of the technology at hand. Social media channels such as Facebook and Twitter allow the team to provide daily updates and interact with people from all over the world. You can watch them on Facebook Live as they give a breakdown of that month’s outlook, with live chat functions allowing real-time questions. Multimedia graphics make the information way more accessible, and the share functions of social media mean the content can reach audiences beyond those of just local weather enthusiasts.

However, back in the 90s and early 00s, it was a different story. Instead, our meteorologists would jump in a car or on a plane and physically travel around the country to deliver public seminars to disseminate the data of the latest SCO. Every single month. Think of the time, money and fossil fuels that would have taken!
Despite their best efforts to make accurate predictions and communicate that information to the world, forecasters often find themselves at the centre of public frustration.
“The immense complexity of what goes into creating outlooks and the domain knowledge needed to clearly break the information down can sometimes be lost or forgotten because we almost take forecasting for granted these days. And while the adage of ‘blame it on the weather man’ is something my colleagues and I are very familiar with, forecasting and our methods of communicating have vastly improved over the decades,” said Mr Noll.

The importance of climate outlooks
For the everyday person wondering whether to book a festival over a summer predicted to be wetter than average, climate forecasting can be of mild interest. But beyond that, they can be quite literally lifesaving.
SCOs are vital for media, businesses, government, and the primary industries to plan and adapt. The outlooks can prove helpful to water managers, particularly those involved in the South Island hydro power schemes. They can also help farmers understand if irrigation may start early or if extra feed is needed to cope with a particularly dry summer. The health sector may be wondering about heat stress, which is of growing concern as our climate warms. Coastal scientists may be wondering how long a marine heatwave might last as part of an assessment of krill behaviour and its impact on penguins. These are just a few of the types of questions that the SCO can help answer.
NIWA is also not constrained by borders, providing seasonal outlooks for the Pacific Islands through the Island Climate Update, which is also celebrating its 25th birthday this year.
There, seasonal outlooks of rainfall have been coupled with health data to derive a malaria risk outlook for the Solomon Islands. Dam levels can also be estimated to determine the chance for water shortages in Samoa. These types of outlooks highlight the intelligence that can be generated when sectoral data intersects with climate data.
“Weather and climate can literally make or break a season for people that depend on it for their lives and livelihoods. Therefore, the implications of an accurate and well-communicated seasonal outlook can be significant,” said Mr Noll.
What the future holds
Ben has several ideas and dream scenarios for the future, including a personalised app.
“In my dream world you would have an app which gives you not just the specific weather for the next 5 days, but a prediction of weather “themes” for the next month and three months, translated into regionally relevant impact statements that are generated using the latest forecasts and AI. "
Ben Noll, Meteorologist/Forecaster NIWA
“An example of an impact statement could be: ‘there is a high chance for above average winter temperatures in Auckland, so you may not need to run your heater as much and you could consider wearing lighter clothing” or “there is an elevated chance for a heavy rainfall event in 2 to 3 weeks in your area that may cause flooding, so please plan accordingly,” said Mr Noll.
Ben’s vision for the future could easily be made possible thanks to the fact that many international forecast centres, called global producing centres (GPCs), are now providing open access data at a global scale. NIWA is not a GPC, but it uses data from GPCs to create outlooks that are regionally relevant to New Zealand.
“We’ve entered a golden age of data availability toward better seasonal predictions. And with the rise of artificial intelligence, forecast skill continues to improve. Our deep understanding of the physical science is being married with decades of dense data collection and AI output, which, when combined, exponentially grows our ability to recognise and predict climate patterns,” said Mr Noll.