A weekly update describing soil moisture patterns across the country to show where dry to extremely dry conditions are occurring or imminent. Regions experiencing significant soil moisture deficits are deemed “hotspots”. Persistent hotspot regions have the potential to develop into drought.
Recent rainfall and current soil moisture conditions:
In the North Island, the greatest rainfall amounts over the last seven days fell across the central North Island, mainly about Taranaki, Waikato, the Manawatū, and the eastern Bay of Plenty, where 75 to 100 mm of rain fell, with a few locations seeing over 100 mm of rain. Elsewhere, generally 25 to 50 mm fell across portions of Auckland, the west of Northland, remaining potions of the Waikato, portions of the Bay of Plenty and the Manawatū.
A mere 10 to 30 mm of rain fell across the Wellington region, Hawke’s Bay, Gisborne, areas of the Manawatū south of Wanganui, the remaining portions of Northland and Auckland, and the western Bay of Plenty. Remaining areas of the North Island generally recorded 30 to 50 mm of rain over the last seven days.
Soil moisture levels generally saw small to moderate increases across the entire North Island in the past week. The driest soils across the North Island, when compared to normal for this time of the year, are found around Napier, while the wettest soils for this time of the year are generally found in the Auckland region, coastal Bay of Plenty, the Far North, around Wanganui, and about Cape Turnagain.
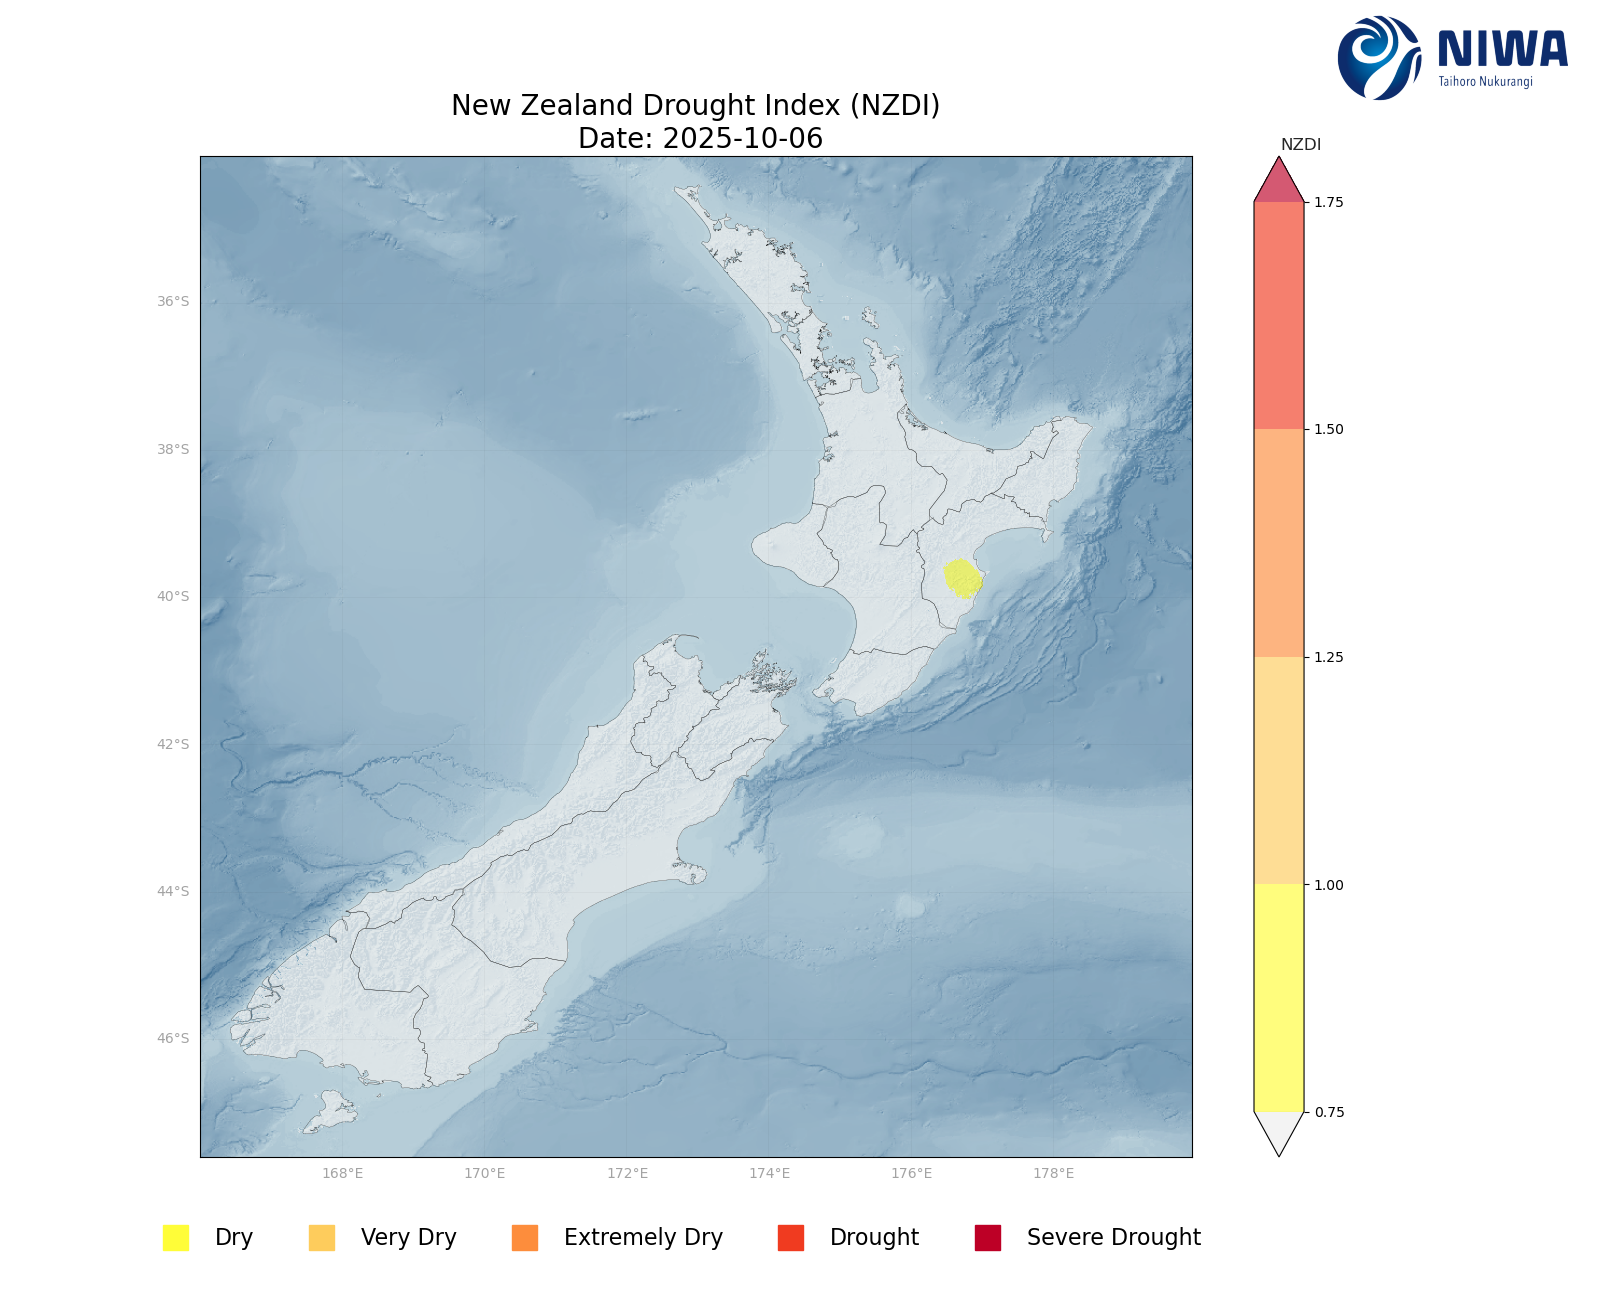
No hotspots are currently located in the North Island. However, as of 6 October, the New Zealand Drought Index (NZDI) map shows that drier than normal conditions are currently found in the Napier area.
In the South Island, 50 to 100 mm of rain fell in the past week across most of the West Coast, with pockets as high as 150 mm. Inland portions of Otago and Southland, the Tasman district, and about Banks Peninsula generally observed 30 to 60 mm. However, much of Marlborough and Canterbury only received 10 to 25 mm.
Soil moisture levels generally increased slightly across the South Island in the past week, although larger increases were observed around Banks Peninsula, South Canterbury, and Otago. The driest soils across the South Island, when compared to normal for this time of the year, are found in a small portion of coastal Canterbury and in Marlborough around Blenheim and the Wairau Valley, while the wettest soils for this time of the year are generally found in interior Otago and about Banks Peninsula in Canterbury.
No hotspots are currently located in the South Island.
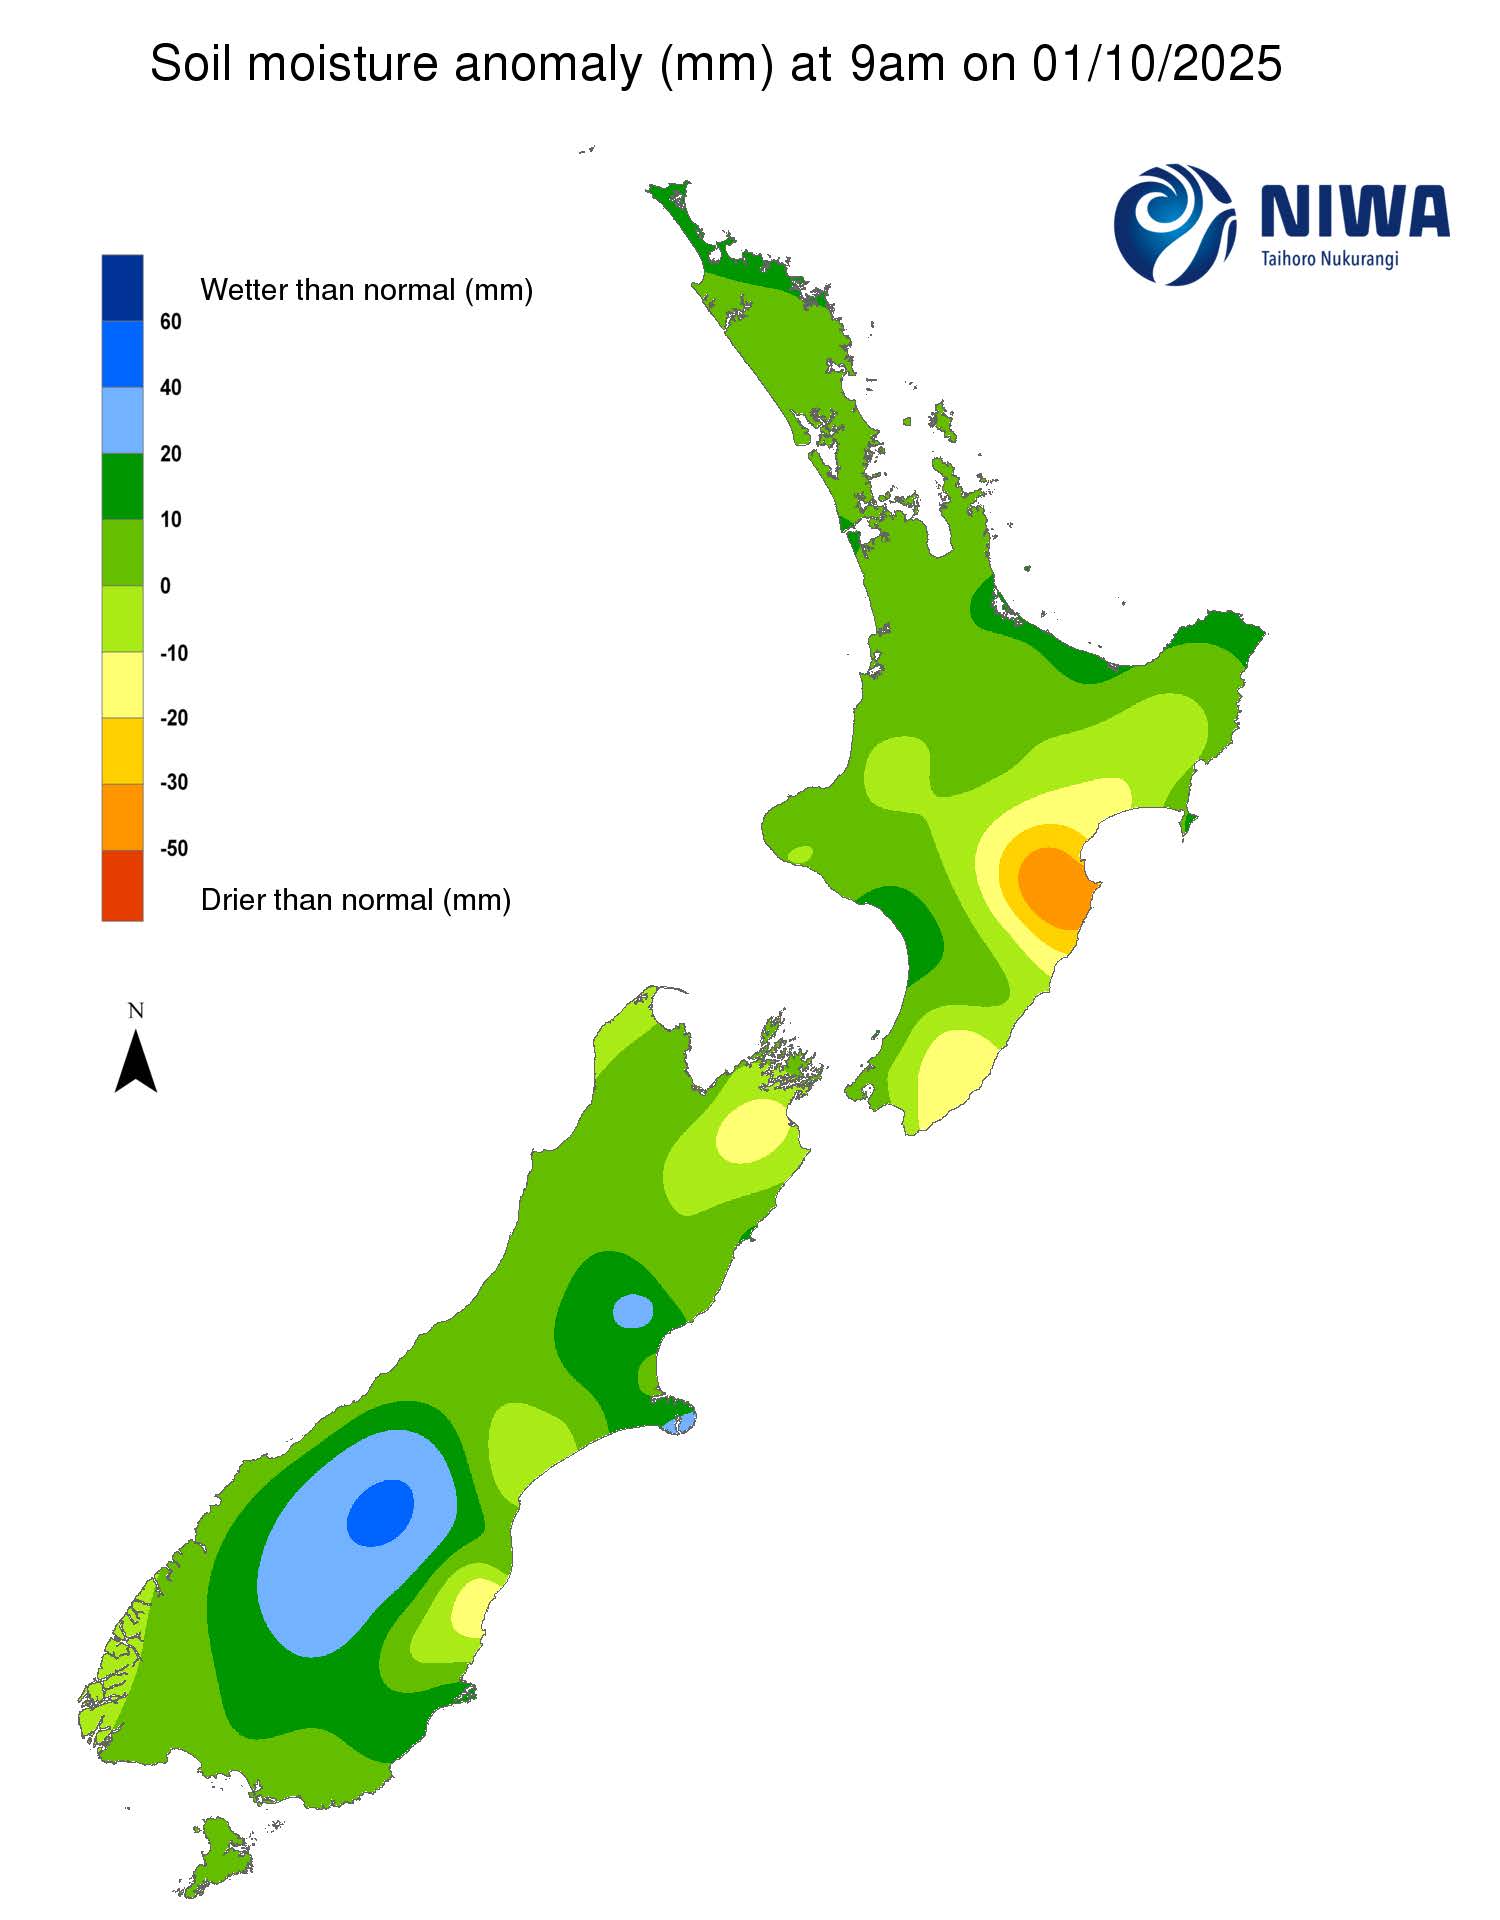
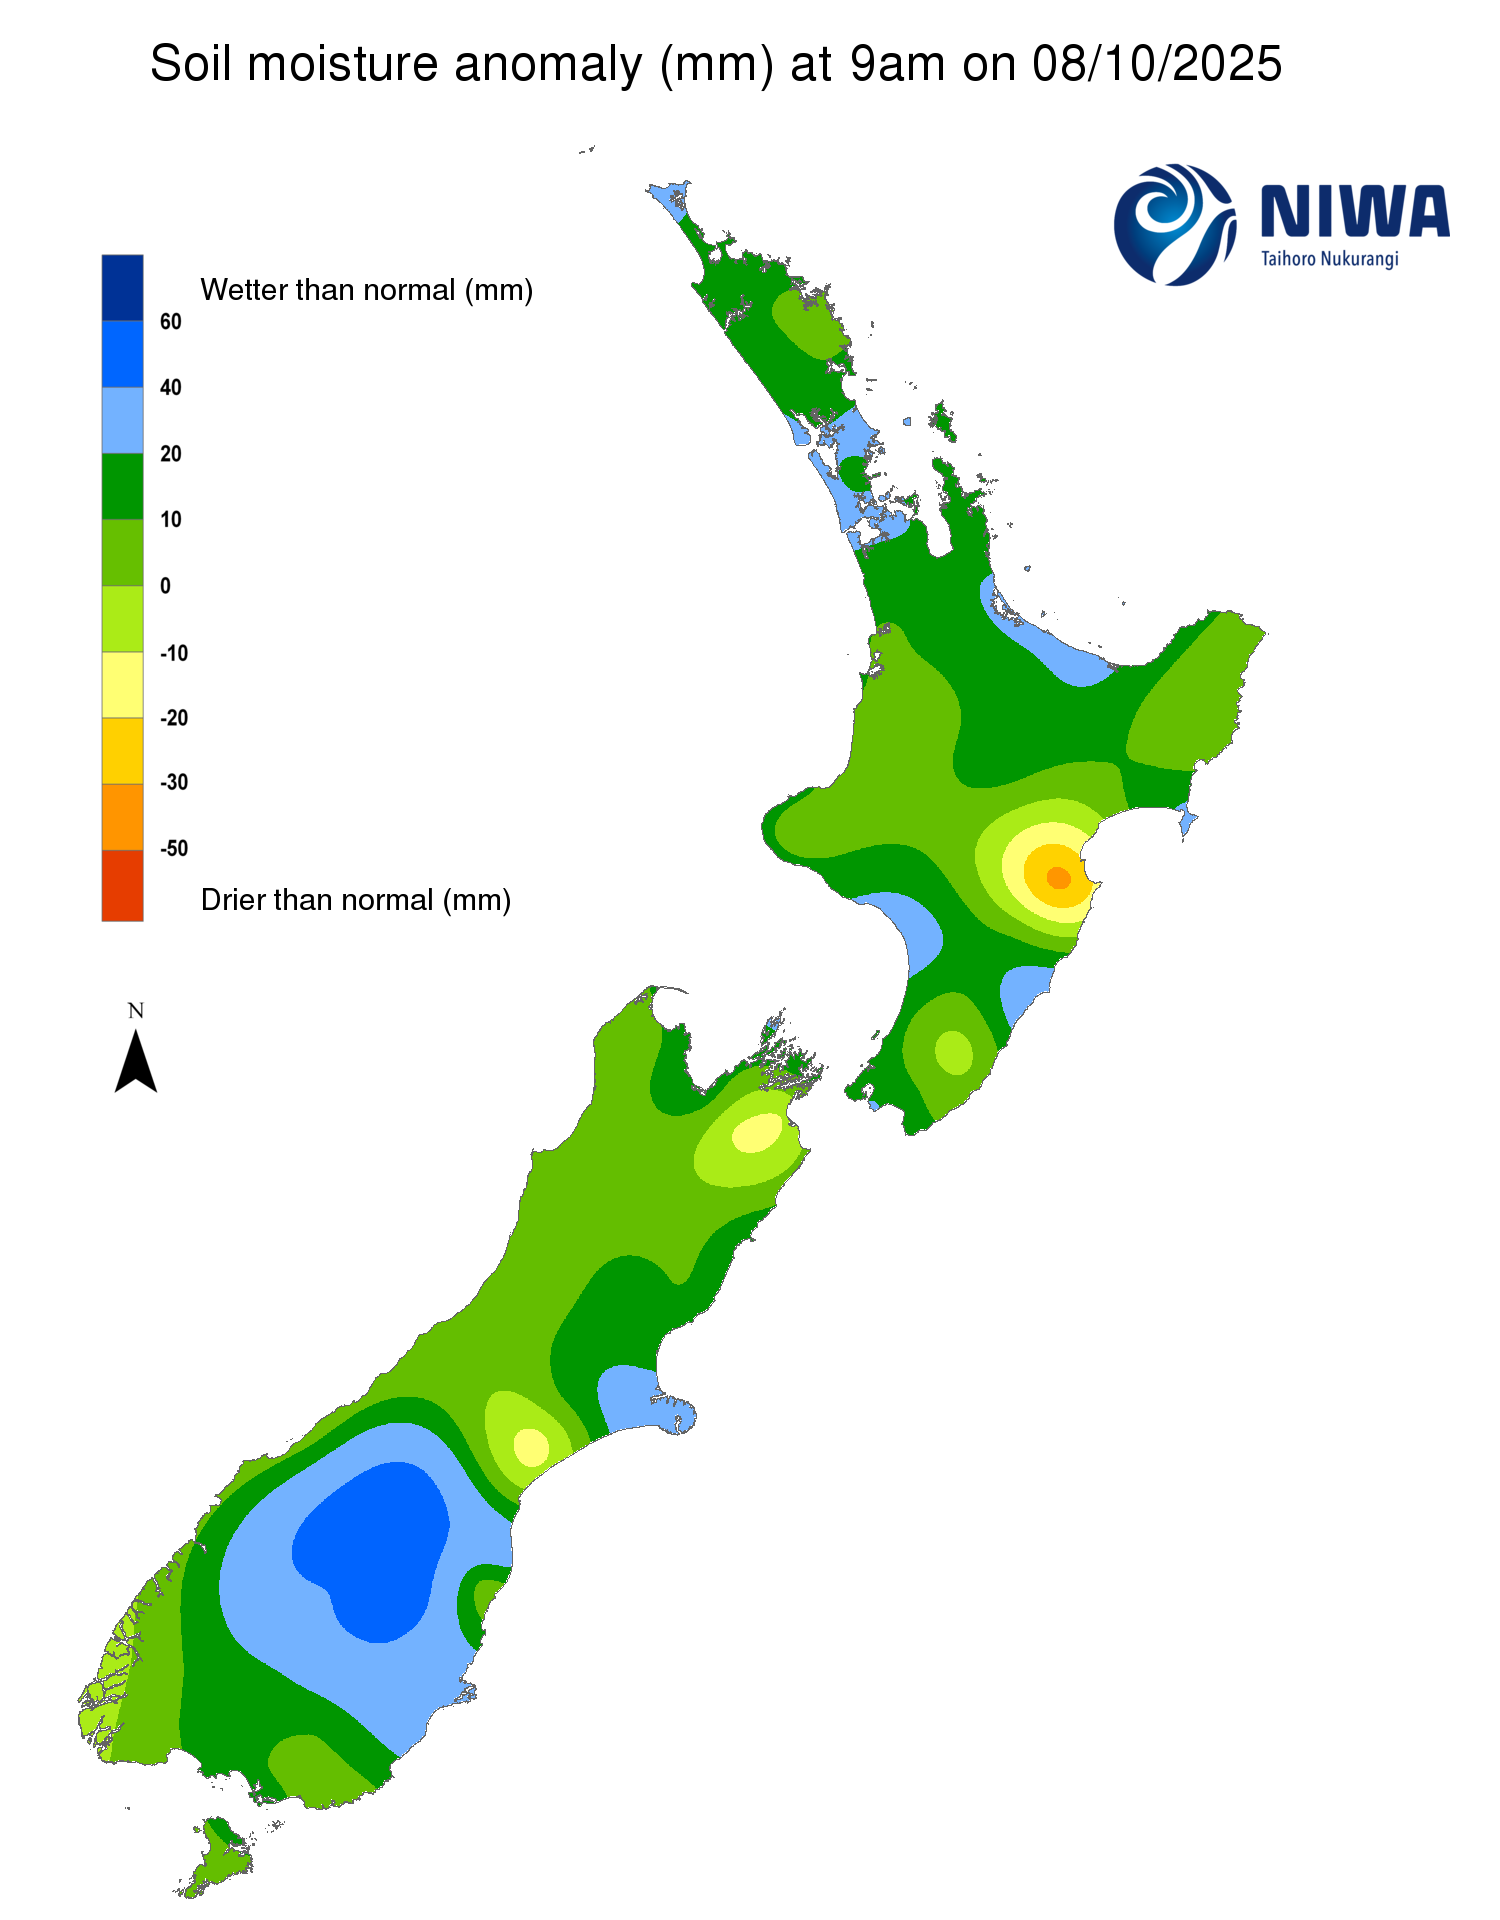
Pictured above: Soil Moisture Anomaly Maps, relative to this time of year. The maps show soil moisture anomalies over the past two weeks.
New Zealand Drought Index (NZDI)
As of 6 October, the New Zealand Drought Index (NZDI) map shows that drier than normal conditions are currently found in the Napier area.
Please note: some hotspots in the text above may not correspond with the NZDI map. This difference exists because the NZDI uses additional dryness indices, including one which integrates the rainfall deficit over the past 60 days. Changes are therefore slower to appear in the NZDI compared to soil moisture anomaly maps that are instantaneously updated.
The week ahead:
High pressure will sit east of the North Island, with a slow moving front moving into the country 9 to 12 October, bringing only light to moderate rain to the North Island. Another slow moving weather system will move across the country from Sunday night through Tuesday (12 to 14 October), leading to moderate to heavy rain across the North Island. Showery weather is expected 15 to 16 October. Weekly rainfall totals of 50 to 100 mm may be widespread across the central and western North Island, with generally 25 to 50 mm elsewhere.
Due to the expected rainfall in the next week, only small changes to soil moisture levels are likely for most of the North Island. A slight decrease may occur in the eastern North Island and for Northland, while slight increases may occur in the western North Island. A slow moving front will move into the South Island from 9 to 12 October, leading to periods of heavy rain that will impact the west of the South Island.
Another slow moving weather system will move across the South Island from 12 to 14 October, leading to more heavy rain in the west of the South Island. Showery weather is expected 15 to 16 October, with some moderate rain for the southwest of the South Island on 16 October. Weekly rainfall totals will generally be 150 to 200 mm for the West Coast and Tasman District, with isolated locations seeing over 200 mm of rain.
Elsewhere, expect 50 to 100 mm, except for the east of the South Island, where weekly rain will generally range from 10 to 25 mm. Due to the expected rainfall in the next week, slight soil moisture increases may occur in much of the western South Island. For Otago, Marlborough, and the low country of Canterbury, a slight decrease in soil moisture may occur.
Long-term outlook (through early November):
- The drier (25th percentile) rainfall scenario shows below normal rainfall across the east and the top of the South Island and most of the east coast and the north of the North Island, including very dry conditions in coastal Otago, South Canterbury, coastal Hawke’s Bay and Gisborne.
- The middle (50th percentile) and upper (75th percentile) rainfall scenarios show a wet signal for the west of both the North and South Island, with potential for very wet weather in the west of both the North and Sound Island in the wetter scenario.
- Very dry soil conditions may begin to affect the east coasts of both islands in the drier scenario.
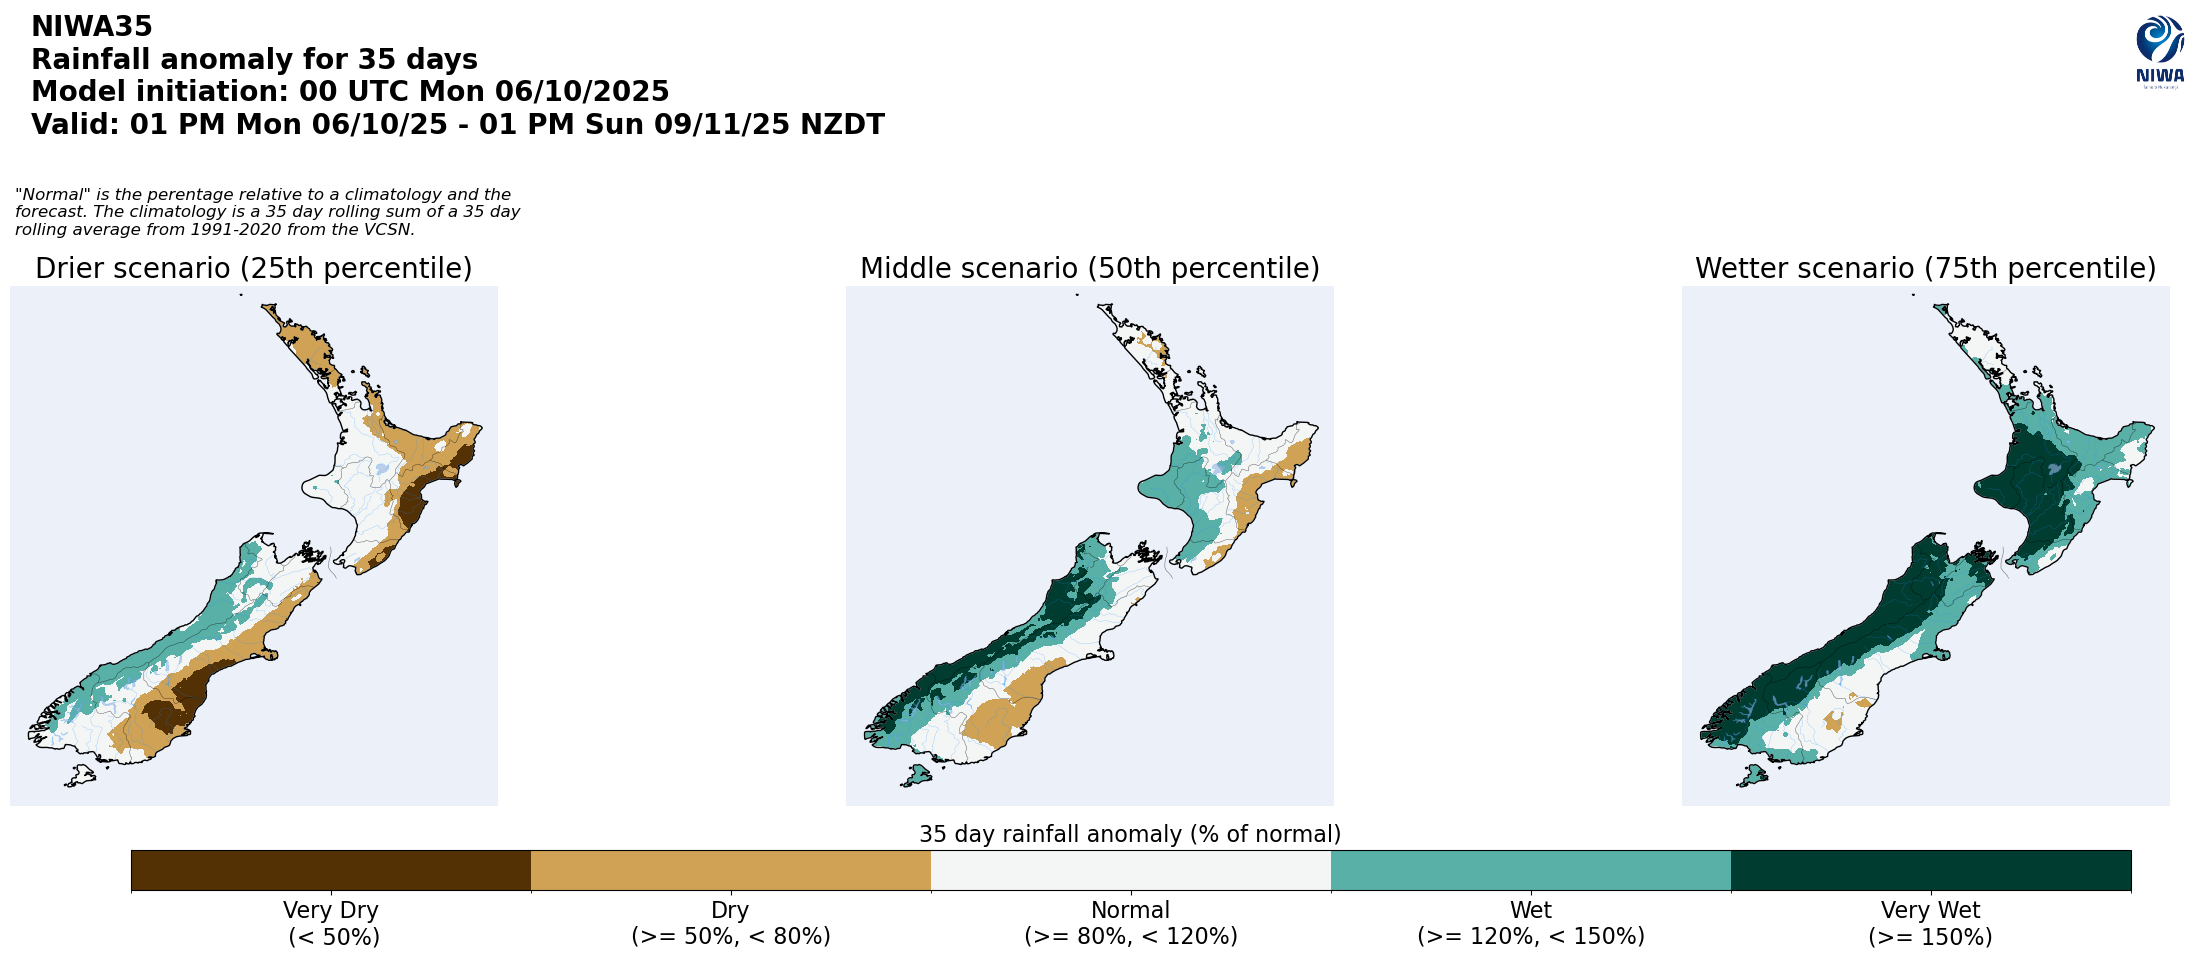
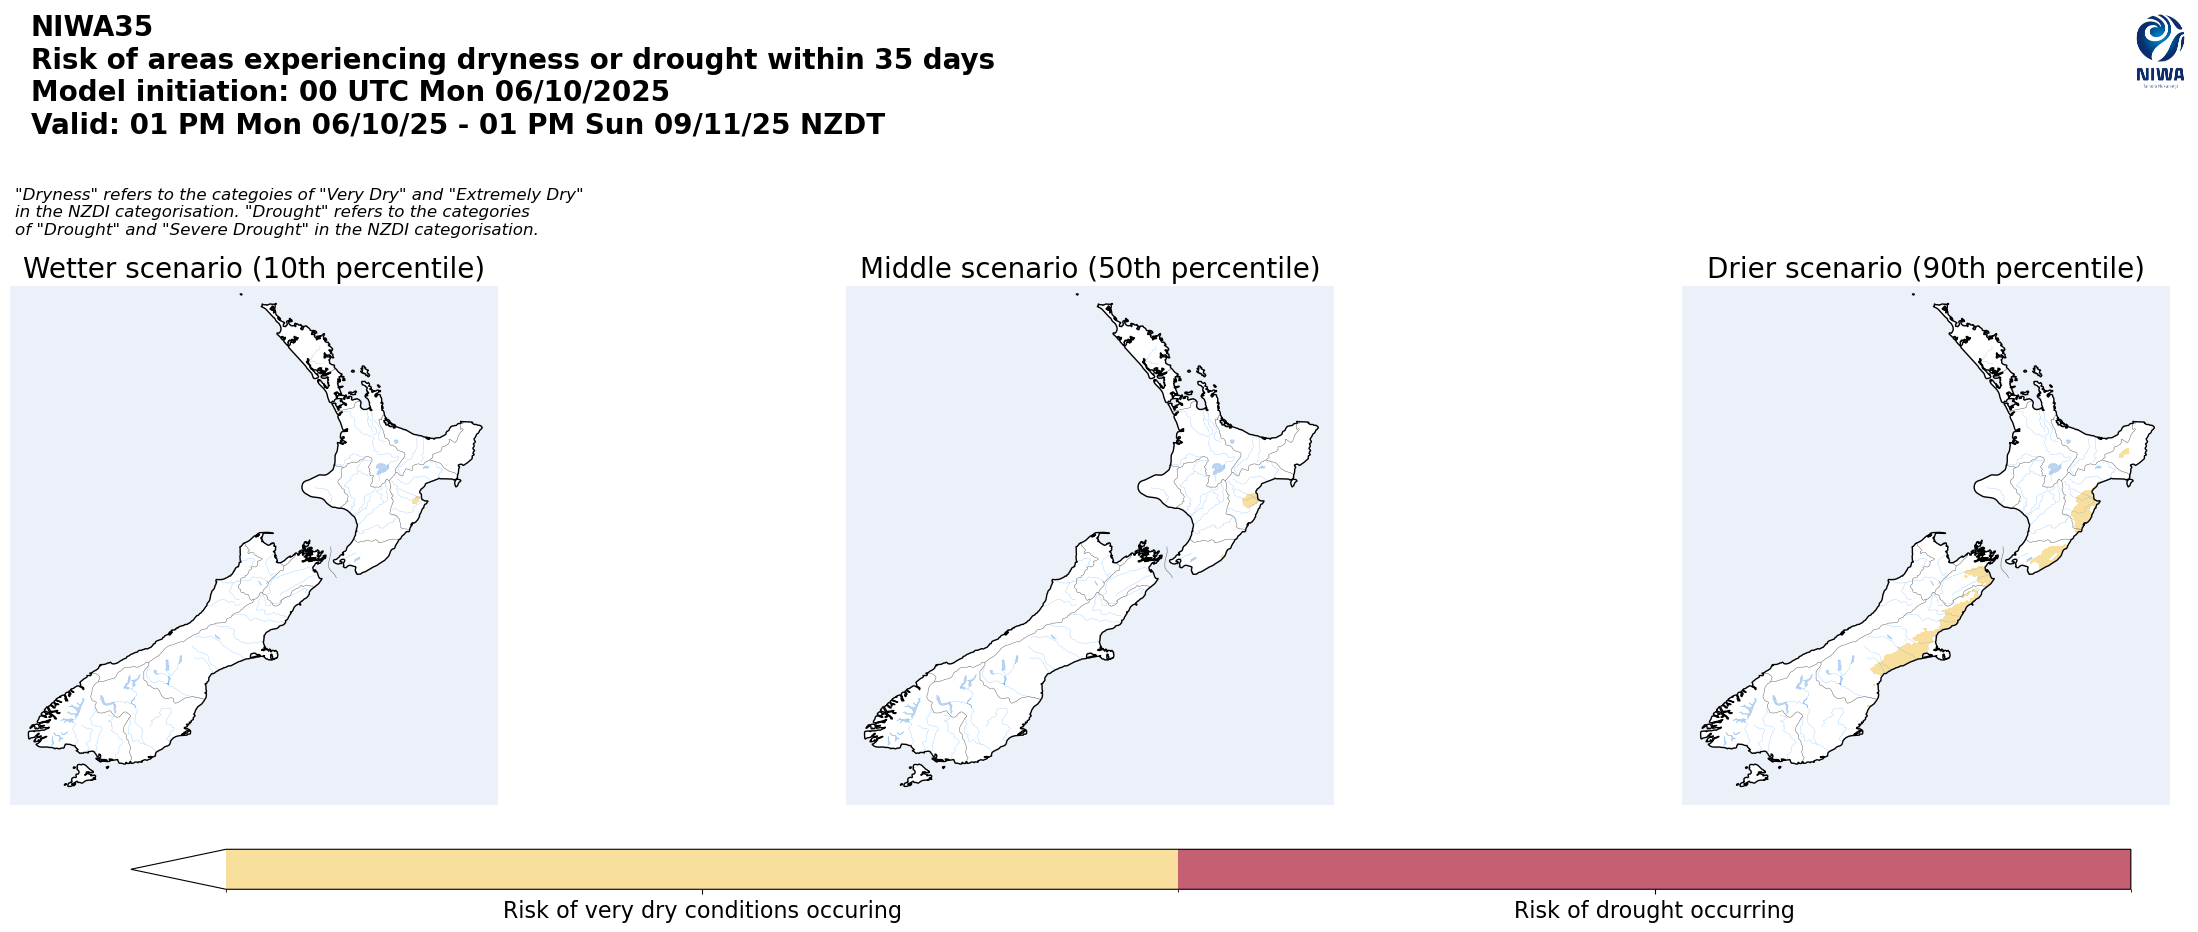
Pictured above: 35-day forecast rainfall anomaly scenarios (Top), and 35-day forecast dryness and drought scenarios (Bottom). These maps are updated daily at https://niwa.co.nz/climate/seasonal-climate-outlook
Background:
Hotspot Watch: a weekly advisory service for New Zealand media. It provides soil moisture and precipitation measurements around the country to help assess whether extremely dry conditions are imminent.
Soil moisture deficit: the amount of water needed to bring the soil moisture content back to field capacity, which is the maximum amount of water the soil can hold.
Soil moisture anomaly: the difference between the historical normal soil moisture deficit (or surplus) for a given time of year and actual soil moisture deficits.
Definitions:
“Extremely” and “severely” dry soils are based on a combination of the current soil moisture status and the difference from normal soil moisture (see soil moisture maps)
Hotspot: A hotspot is declared if soils are "severely drier than normal" which occurs when Soil Moisture Deficit (SMD) is less than -110 mm AND the Soil Moisture Anomaly is less than -20 mm.