PDF of this article (236 KB)


NIWA scientists are developing methods to trace the sources of air pollution and determine their relative contribution to air quality problems. Perry Davy and Tom Clarkson work closely with regional councils to solve air pollution puzzles.
Air pollution has a direct effect on human health, from subtle interactions with the respiratory system (asthma, shortness of breath) to the risk of hospitalisation or even death. Long-term exposure to high levels of fine particles increases the risk of heart and lung disease. In New Zealand, despite our minimal heavy industry and our small population base, we don’t escape the problem of air pollution and its consequent health effects. A number of urban areas, including rural towns like Taumaranui and Alexandra, have air pollution problems, particularly during the winter.
Setting national standards
The air pollution issue prompted the New Zealand Government to introduce mandatory air quality standards: the National Environmental Standards for Air Quality (NES). There are five standards for ambient (outdoor) air quality to keep the air outdoors clean and safe for people to breathe. These standards deal with pollutants like sulphur dioxide, carbon monoxide, nitrogen dioxide, ozone, and smoke and dusts. These last two are collectively referred to as fine particles, and denoted as PM10, which indicates particles less than 10 micrometres (or microns) in diameter. Since September 2005, regional councils have been required to monitor air quality and publicly report if the air pollution in their region exceeds the ambient standards. In areas where air pollution exceeds the NES, councils must make improvements to achieve compliance by 2013.
Cause and effect
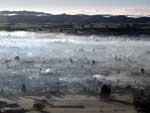
Air pollution is the result of a complex interaction between local weather and the quantity of pollutants emitted to the atmosphere from various sources. The more pollution that is emitted in an area, the higher the local ambient air pollution concentrations are likely to be. If the area is also windy, however, then the air pollution will be well dispersed (blown away). The worst air pollution occurs when large quantities of pollutants are emitted into a calm atmosphere. In New Zealand, this is most likely to occur during cold and frosty conditions in winter. At some locations, PM10 concentrations can be many times higher than the NES throughout the winter period.
Sussing out sources
Routine air pollution monitoring only provides information about the local concentrations of pollutants such as PM10 but does not tell us anything about the sources of that pollution. Of course, before we can do anything about it, we need to know what the sources are and how much they contribute to air pollution; this is called source apportionment. Working closely with Greater Wellington Regional Council, NIWA has been researching two source apportionment methods in order to understand PM10 pollution at Masterton, where the NES for PM10 is exceeded every winter.
Method 1: emissions inventory and airshed modelling
An emissions inventory estimates the quantity of pollutants emitted from different sources, such as motor vehicles, industries, or domestic solid fuel fires used for home heating. For example, a recent survey by the Ministry for the Environment found that a total of 112 tonnes of wood are burnt per day during a typical July by households in the Masterton urban area. We combine these estimated emissions with local meteorology using a sophisticated three-dimensional dispersion model, called an airshed model. We can then predict how all these emissions of PM10 mix in the atmosphere to produce the total concentration of PM10 measured at a particular point, such as the Masterton air quality monitoring site operated by Greater Wellington. If the modelled (predicted) and measured (actual) concentrations agree, then we are on the right track.
Method 2: receptor modelling
Each source of pollution has a different combination of chemical elements. From this elemental ‘fingerprint’, or source profile, we can infer the contributions of different sources to PM10 concentrations. In practice, we collect and analyse two subsets of PM10: particles with a diameter less than two microns (PM2.0) and particles with diameters between two and ten microns (PM10–2.0). This detail reveals much more information on the various contributors to air pollution.
The advantage of the receptor modelling method is that it can tell us about the contributions of pollutants from natural sources, the ‘background’ PM10. The background in Masterton is composed of particles from marine aerosol, wind-blown dust, secondary particles formed in the atmosphere from gas-to-particle conversion processes, and some pollen and other biological detritus. We’re interested in background concentrations of fine particles because there’s not much that can be done about controlling those sources and this fraction has to be removed from the equation when regional councils are formulating strategies to reduce air pollution.
What’s the best method for Masterton?
By comparing the results of the two source apportionment methods, we can test the validity of both. The pie charts present the average winter results for 2003 and 2004 and show us several things, for example:
- Domestic fires are by far the greatest contributor to PM10 air pollution in Masterton.
- About a third of the particle concentrations are from background sources (marine aerosol, wind-blown soil, etc.).
The two different approaches provided similar results, which gives us (and the regional council) confidence that the proportions are about right. These results are an average over the entire winter period, but what about an individual pollution event when the NES has been exceeded? The third pie chart shows us the source contributions for a single day when measured PM10 in Masterton was 59 μg/m3 (compared to the NES of 50 μg/m3). Now we see domestic fire sources dominating PM10 concentrations on an individual pollution day (77% or 45 μg/m3).
Have we solved the problem?
From our research we now know that the peaks in air pollution concentrations during the winter are mainly due to smoke from domestic fires, with a minor component from motor vehicle exhaust emissions. The background PM10 contribution (approximately 6–8 μg/m3) was found to be relatively constant at Masterton. We have also determined that the two source apportionment approaches are valid.
Greater Wellington now needs to decide how to reduce emissions during the winter in Masterton in order to meet the NES by 2013, and this could be a major headache in itself. We can still help with deciding on the most effective measures to curb air pollution in Masterton – before any make it off the drawing board – by using the emissions inventory and airshed model method to predict PM10 concentrations from future emissions scenarios.
NIWA scientists are currently collaborating with the Hawke’s Bay and Auckland regional councils to determine the sources of air pollution in those regions, too.
Clearing the air
- Air pollution is a problem for some New Zealand towns and cities, especially in winter.
- Solving the problem first requires identifying the sources of pollution.
- Two methods have been used for ‘source apportionment’ so local authorities can determine where improvements are needed.
Perry Davy and Dr Tom Clarkson are air quality scientists based at NIWA in Wellington. They thank Greater Wellington Regional Council for use of data and images, and also acknowledge their collaborator Dr Shanju Xie, formerly of NIWA in Auckland.
Teachers’ resource for NCEA Achievement Standards or Unit Standards: Geography Level 1 AS90207, Level 2 AS90336, Level 3 US5097 Science Level 2 US6352, Level 3 US6355 See other curriculum connections at www.niwa.co.nz/pubs/wa/resources
