PDF of this article (117 KB)
Richard Turner Jim Renwick Susanne Schroeder
A large scientific effort has helped ensure that the accuracy of weather forecasts is improving all the time.
It has long been the case that weather forecasters have needed very thick skin if they did not want public comments about their predictions to affect them personally. Forecasters have often felt that people just don’t appreciate the complex technology and expertise that goes into weather forecasting. Much of the lack of understanding probably stems from the need to present forecasts to the public simply and clearly (which is as it should be).
This step of simplifying the language masks any underlying scientific advances in meteorology. So, it might surprise critics to learn that a five-day forecast in 2003 is as good as a one-day forecast was in 1953. This has been made possible through the development of reliable and accurate Numerical Weather Prediction (NWP) systems. NWP models probably rank among the great scientific achievements of the last century, on a par with the discovery of DNA and advances in understanding of atomic structure.
How well do different models work in New Zealand?
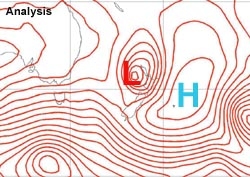
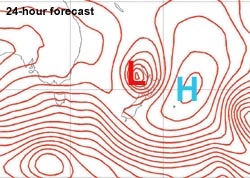
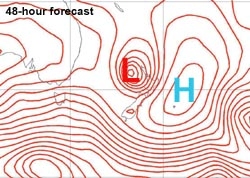
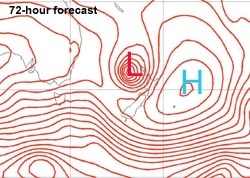
The UM analysis at 12 UTC 20 June 2002 of the Mean Sea Level Pressure (MSLP) field, and forecasts made for that time 24, 48 and 72 hours in advance. The blue Hs mark the analysed centres of anticyclone, while the red Ls mark the analysed centre of the bomb.
Part of the work done at NIWA over the past few years has been to analyse the skill of NWP models used widely by weather forecasters and scientists in New Zealand. The models’ performances were generally very encouraging. Modern forecast models were assessed to be very good at predicting the major features that control weather in New Zealand – the mainly eastward-moving cyclones and anticyclones.
To illustrate just how good NWP forecasts have become, let’s take a look at the infamous “weather bomb” that caused widespread damage and the tragic loss of one life in the Coromandel in 2002.
At midnight on 19 June a weak low-pressure system was located about 500 km north-northwest of Auckland. In the next 24 hours this system deepened almost explosively into an intense mid-latitude cyclone lying just west of Auckland. (The rapid change is the reason for the term “bomb”, which has a technical definition of a decrease in a low’s central pressure of more than 24 hPa in a 24-hour period.) The maps show how forecasts made 1, 2 and 3 days ahead of the event all predicted it correctly. An impressive display!
More difficult to predict from these accurate large-scale patterns would have been the fine details. For example, what was the expected exact timing of the heavy rain and where would it occur? Unfortunately, some of the factors that influence local rainfall amounts occur on hourly or shorter time scales and are unpredictable even 2–3 days in advance.
Comparing models
In a broader study, we assessed two models: the European Centre for Medium Range Weather Forecasting (ECMWF) global model and the United Kingdom Meteorological Office Unified Model (UM). (The latter produced the weather bomb forecasts shown above.) Questions we asked included:
- Which model performed better in forecasting low-pressure systems that develop in the North Tasman? (Many of the storms that cause damage in New Zealand are of this type.)
- What were the model biases and errors (RMSE) for these storm types?
- Does one model perform better than the other during the 3–4 days it takes for a storm to develop and cross New Zealand?
- Are the models’ performances improving?
We found that both models gave much the same results. Both models tended to displace the storm centres to the southeast. The ECMWF model also tended to make lows too intense, and at times the UM did not make them intense enough. Overall, the ECMWF model seemed to be slightly better at predicting the development and passage of individual storms.

We found that the error (measured as RMSE) of forecasts of surface pressures in low-pressure systems for New Zealand decreased by about 18% for 48-hour forecasts from June 1998 to December 2000. This agrees with findings by the UK Meteorological Office, which showed an improvement in the monthly averaged skill score of forecasts of mean sea-level pressure in the Southern Hemisphere from about 70 in 1996 to about 85 in 2002 (see graph). The graph also shows that the Southern Hemisphere has been catching up with the Northern Hemisphere. One reason for this lies in improved techniques for translating satellite data into models. The improvement has more impact in the Southern Hemisphere because fewer conventional surface and upper-air observations were made here. Thus Southern Hemisphere forecasts tended to be less accurate in the past.
Forecasting on different scales
This summary has concentrated on the forecasting of the large-scale features that control the day-to-day weather in New Zealand. When other scales are considered – such as seasonal forecasting on a national scale, or 6–12-hour local rainfall forecasts – there are still many uncertainties.
In the next few decades research in large-scale numerical weather prediction will focus on:
- how to incorporate types of data that are available but not currently input into NWP models;
- multiple forecasts with the same model but using a range of initial conditions to cover some of the uncertainties in the observations;
- refining model physics (for example to better represent model moist processes such as the growth of cloud water droplets).
Such research should result in steady improvements in forecasts. More rapid progress can be expected in the forecasting of systems at the other scales where the science is still young and/or the observing systems could be improved.
Teachers: this article can be used for NCEA Achievement Standards in Science (2.5, 3.5). See other curriculum connections at www.niwa.co.nz/pubs/wa/resources
Richard Turner, Jim Renwick and Susanne Schroeder are based at NIWA in Wellington.
Assessing weather forecasts: some terminology
Mean sea-level pressure (MSLP): the basic piece of information used by a weather forecaster. Charts of MSLP are commonly displayed on a newspaper’s weather page, showing Highs (e.g., anticyclones) and Lows (e.g., depressions).
Analysis (analysed MSLP): a best estimate of the actual mean sea-level pressure field at a given time, made by applying theory to observations.
Bias: average of the difference between forecast and analysed MSLP.
RMSE: root mean squared error, the square root of the average of the squared differences between forecast and analysed MSLP.
Skill score: = (1 – Rf2/Rp2)*100 , where Rf2 is the RMSE of the model forecast and Rp2 is the RMSE of a persistence forecast. A persistence forecast is one where the analysis at the start of the prediction run is taken as the forecast for all future times, that is, it persists into the future, or more simply the weather is forecast not to change. A skill score of 100 is perfect; 0 is what a persistence forecast would score.