PDF of this article (113 KB)

Yves Le Gonidec Geoffroy Lamarche Ian Wright
Multibeam mapping produces accurate and detailed maps of the seafloor, but that’s not all. A recent project has investigated ways to extract information on seabed composition from multibeam backscatter data in New Zealand waters.
Multibeam mapping of the seabed is an important tool for both research and commercial applications (see “Managing the seabed with multibeam mapping.”). The method works by sending sound waves to the seafloor from equipment mounted on a ship’s hull and measuring the time it takes for the signals to return. This time is directly related to water depth. Therefore it is possible to build up a detailed map of the seafloor from many measurements. However, the technique has potential to provide even more information because the strength (or amplitude) of the returned signal – recorded as sound in decibels (dB) – can tell us about the nature of the seabed.
Seafloor backscatter strength
Backscatter strength is best thought of as a measurement of how strongly an acoustic pulse reflects from the seafloor and the amount of scattering. This so-called reflectivity depends on what the substrate is made of (for example, mud, sand, gravel, bedrock or a mixture of these), and how rough or lumpy the seafloor is.
Think of dropping a couple of tennis balls onto different surfaces. If they fall onto hard, flat concrete, they will bounce straight up quite a long way. But if they fall on soft irregular sand they will hardly bounce at all. And if you drop tennis balls onto a pile of large river cobbles, the balls may bounce, but you won’t know in which direction they are going to go.
In the same way, sound waves hitting the seabed will bounce back in different ways depending on what they hit. For instance, there will be different signals from tall corals on rock, from gravel waves, and from sand substrates with small ripples.
Just as aerial photography can show up geological formations on land, images of seafloor backscatter can help us to identify different submarine geological processes. It can also distinguish different substrate types (mud, gravel) and associated biological habitats.
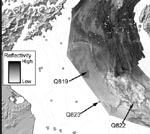
Until recently the images produced by the multibeam backscatter were grey-scale mosaics. Regions of white or light grey corresponded to low backscatter (interpreted as soft sediments); black or dark grey regions indicated high-intensity backscatter (interpreted as exposed bedrock outcrops). Described below is an ongoing project aimed at devising and testing ways of extracting much more detailed information.
Linking backscatter to substrate


The multibeam system on NIWA’s research vessel Tangaroa has 135 separate acoustic beams and each swath of the sea floor is up to 5 km wide. Each beam hits the ocean floor at a different angle, varying from 0° directly beneath the ship to 60–65° at the edge of the swath. We need to account for this when interpreting backscatter. We also need to consider other characteristics affecting the sound waves as they travel to the seafloor and back. These include variable attenuation of the signal depending on salinity and distance travelled through the water column, and interaction with the seafloor. For these reasons interpreting the backscatter can be very complex.
To test how well the backscatter signals could differentiate between substrates, we ran a series of tests in areas where the substrate type was known. Cook Strait was an ideal location for this because, compared with other offshore areas around New Zealand, the seafloor there has been intensively surveyed. NIWA has sediment grab samples, seafloor photographs, and video-transect footage from over 200 stations.
We selected multibeam data gathered by RV Tangaroa from four areas with distinctive substrate types. We had good photographs of the seafloor in each area which showed that the substrates were uniform over the area of the acoustic beams.
The data comprise a consecutive series of “pings”, where one ping is one full cycle of all 135 beams simultaneously transmitting acoustic energy from the hull-mounted equipment and then recording the subsequent reflection back to the ship. One full ping cycle takes 1–7 seconds, depending on water depth. Backscatter profiles were computed for each substrate type, averaged over several pings. Profiles for the four selected areas show distinctive variations of backscatter strength with increasing beam angle on the seafloor.
A different approach is required for areas of mixed substrates. These can be detected by analysis of the standard deviation – a measure of variability – of mean backscatter strength. High standard deviations indicate mixes of different sediment types.
To obtain a better idea of the composition of mixed sediment types we have developed another statistical technique. This is based on the 3-dimensional distribution of paired incidence angle–backscatter strength data. Each pair provides information about the geological make-up of the substrate at that point.
We used this technique on backscatter data acquired on a submarine volcano north of New Zealand. Here it was possible to differentiate soft sediments and lava flows within an area of mixed substrates.
Software changes

Translating multibeam backscatter data into information about the seabed requires an efficient processing system. We modified the multibeam processing software (MB) to extract the backscatter signal so that we can apply the corrections and processing described above. The MB processing system is open-source software, developed in the USA and widely used in processing multibeam data.
Using the analysis from Cook Strait we have developed new software interfaces to process multibeam image data. These will accept ground-truthing information, and hence can provide a quantitative analysis of backscatter data. Integration into the system of other bathymetry, geological, and ecological information from other areas around New Zealand will help us to predict seafloor substrates so as to improve knowledge of seafloor processes and benthic habitats.
Teachers: this article can be used for NCEA Achievement Standards in Physics (2.2, 2.1, 1.3, 2.3, 3.3). See other curriculum connections at www.niwa.co.nz/pubs/wa/resources
Yves Le Gonidec was based at NIWA in Wellington under NIWA’s post-doc programme; he is now at CNRS, France. Geoffroy Lamarche and Ian Wright are at NIWA in Wellington.
This work was undertaken in NIWA’s FRST-funded programme “Consequences of Earth–Ocean Change” (C01X0203)
