PDF of this article (1 MB)

Farah Adeeb David Shooter
From time to time ozone levels in Auckland can be quite high. What do these episodes indicate?

Contour map of weekly ozone concentration (in micrograms per cubic metre) at Pukekohe.
Mankind can be thankful for ozone in the upper atmosphere, which protects us from short-wavelength UV radiation. However, at ground level, ozone is a harmful air pollutant that can impact on community health (see Ozone as a pollutant, below). The gas forms over several hours when its air-pollution precursors accumulate in the atmosphere. These precursors – nitrogen oxides (NOx) and volatile organic compounds (VOCs) – interact in the presence of sunlight to produce ozone.
Nitrogen oxides are emitted from the combustion of fuels, mainly from vehicles but also from coal-burning power plants and natural gas processing. A major natural source of NOx is lightning. VOCs are generated by motor vehicles, industrial processes and from the evaporation of solvents and fuels. About half of New Zealand’s VOCs are from natural sources, for example, trees.
The air quality of Auckland’s lower atmosphere is constantly being monitored. Different pollutants such as ozone, carbon monoxide, particulates and sulfur dioxide are measured and concentrations compared with national guidelines. Occasionally, high ozone levels have been recorded in localised areas of Auckland. Is there any pattern to these occurrences?
What causes localised high ozone levels?

Site 1: Whangaparaoa a coastal site 23 km north-east of Auckland city at the eastern end of Whangaparaoa Peninsula; the ozone monitor is approximately 3 m above ground level.

Site 2: Sky Tower central Auckland; ozone monitor approximately 250 m above ground level. The site is above a congested shopping area of high buildings and narrow streets.

Site 3: Musick Point an urban–coastal site, about 6 km east of Auckland city centre; ozone monitor approximately 15 m above ground level. In a prevailing westerly wind, this site is downwind of the city and so can be influenced by a mix of residential, traffic and industrial discharges.

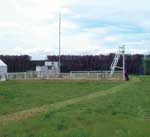
Site 4: Pukekohe semi-rural, 30 km south-southeast of central Auckland; ozone monitor approximately 3 m above ground level in an open field. The immediate area is predominantly agricultural, with a low population density and no point sources of precursor gases.
At least three situations can lead to local ozone formation.
- Ozone forms in the locality of emissions of the precursor gases, especially in prolonged calm conditions (i.e., wind speed less than 2 m/s). High ozone may result from a plume of combustion gases from a local source, or from multiple sources when weather conditions favour accumulation of the gases.
- Ozone forms from precursor gases during transport from their source. This is expected in relatively windy conditions such as those prevailing in the Auckland region.
- Ozone forms following transport of the precursor gases from a distant source to a receiving region. This is reported to happen in the vicinity of Sydney, Australia. However, its isolation from other large cities suggests this is unlikely in Auckland.
What is happening with ozone in Auckland?

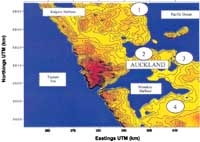
Auckland Region contour map with ozone monitoring stations shown as circled numbers: 1 = Whangaparaoa, 2 = Sky Tower, 3 = Musick Point, 4 = Pukekohe
Ozone concentrations in Auckland are measured at four monitoring sites maintained by NIWA (see map). We used data from these sites to examine the occurrence of high daytime ozone levels.
An example of a weekly ozone cycle at Pukekohe is shown above. This illustrates an ozone episode in which concentrations exceeded 100 µg/m3 (equivalent to 50 ppb (parts per billion)). An ozone episode is said to occur when two or more monitoring sites in a monitoring network indicate higher ozone concentrations than the regional average.
We used data from 1998 to 2000 to calculate daytime ozone averages (1000 to 1800 hrs) when maximum ozone concentrations are normally observed. To examine how similar they were at the different sites we used a statistical method involving the calculation of so-called correlation coefficients. Correlation coefficients range from 0 (= completely different) to 1 (= exactly the same).
Table 1 shows that the correlations between three of the sites (Sky Tower, Whangaparaoa and Musick Point) are high (0.7–0.8), suggesting high formation and regional transport of ozone to the north and the east of the city. The correlation coefficient between the urban sites and the rural site (Pukekohe) is less clear (0.6–0.5). Thus there is probably less significant regional transport of ozone or its precursor gases to the south of the city.
We also calculated how often high ozone levels occurred simultaneously among the sites. Table 2 shows much lower correlation between high ozone days at the four sites. This contrasts with the significant correlations shown in Table 1, which were based on lower ozone concentrations. This suggests that high ozone concentrations result from local influences (i.e., local precursor sources) and not from regional influences. This is as expected since most precursor gases are emitted from the urban areas of Auckland.
Ozone concentrations elsewhere
How do Auckland ozone concentrations compare with those from other locations in New Zealand and overseas?
Measurements in Samoa, considered to be an unpolluted oceanic site in the Southern Hemisphere, range between 5 and 15 ppb. Similar measurements in Auckland range from 10 to 20 ppb and in Christchurch 5 to 12 ppb.
In Auckland daily maxima can be as high as 80 ppb while in Christchurch the maxima are closer to 40 ppb. However, maximum ozone concentrations in overseas cities can be much higher; for example, Sydney can reach 160 ppb, Los Angeles 330 ppb and Mexico City greater than 480 ppb.
Research suggests that damage to plants can occur when ozone concentrations exceed 30–40 ppb. However this is not always easy to determine as other factors such as changes in carbon dioxide concentration and surface-level UVB radiation can complicate data interpretation.
Overall, New Zealand cities have relatively low ozone concentrations, in some cases very close to natural background concentrations. Ozone episodes that do occur appear either to be generated locally or else the precursors are transported via the prevailing southwest wind. These occasional high ozone concentrations could be controlled by minimising the use of vehicles, especially during hot sunny periods in summer when evaporative emissions are higher.
The future
Future trends in ozone concentration will depend to a large extent on vehicle emissions, which in turn will depend on future changes to vehicle numbers, miles driven, driving habits and composition of the vehicle fleet. Improvements in current technology, such as the use of catalytic converters and control of volatile emissions from vehicles, will also play a part. Future ozone concentrations will also depend on the prevailing weather patterns, particularly wind speed and direction. El Niño, the seven-year solar cycle, increasing carbon dioxide concentrations, and increased UV reaching the surface of the earth could also play a role by affecting our weather patterns.
Given what we know about all these factors, our best prediction is that ozone concentrations in Auckland will continue to be low compared with overseas cities.
Teachers: this article can be used for Material World L7 A.O. 4 and Chemistry L8 A.O. 8.1. See other curriculum connections at www.niwa.co.nz/pubs/wa/resources
Farah Adeeb is a PhD student in the School of Geography and Environmental Science (SGES) at the University of Auckland. David Shooter is a member of SGES staff. Both Farah and David are members of the SGES Air Quality Research Group which is funded through NIWA’s Urban Air Quality Processes programme (FRST contract C01X0011).
Ozone as a pollutant
Ozone in high concentrations (>95 ppb) causes respiratory distress in humans. Experiments with human volunteers have shown that ozone produces transient irritation in the respiratory system, with coughing, nose and throat irritation, shortness of breath and chest pains on deep breathing. These symptoms can even be experienced by cycling or jogging in a polluted environment, for example in a city smog. Long-term effects of exposure to ozone are unclear, but it has been suggested that one result could be premature ageing of lung tissue.
Ozone also damages plants and trees and can degrade and crack materials such as plastic and rubber. Tyres and windscreen wiper blades are particularly susceptible.
Ozone breaks down when it attacks materials. This means that in a confined environment (like a closed-off room), where no more is being produced and there are materials available to attack, ozone does not persist for very long.
