Water resources are important to New Zealand’s economy and electricity supply and we are fortunate to receive as much precipitation as we do. Compared with many other countries New Zealand is relatively water-rich. But this abundance varies from year to year, month to month, and region to region, leaving some places with too much at times (flooding) or too little (drought).
To quantify this resource and its variability NIWA has developed a pair of models that allow us to estimate how much precipitation falls anywhere in New Zealand (the Virtual Climate Station Network) and how this precipitation becomes river flow (TopNet). These models are invaluable in providing numbers where the existing precipitation and river flow measurements do not go.
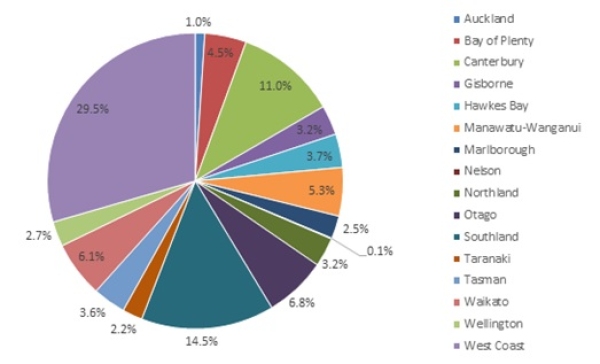
Based on the latest 20 years of analysis, New Zealand receives about 550,000 million m3 of precipitation in an average year – 9 times the volume of Lake Taupo. From year to year this may vary as much as 15% higher or lower. The West Coast receives a quarter of this precipitation despite accounting for less than 10% of the country’s area.
About 20% of the national precipitation in turn evaporates after it lands, with the remaining 80% flowing out to sea and hence become our surface water resource. The West Coast again represents the largest portion regionally (Figure 1), demonstrating that regions are not equally endowed with freshwater resources even after taking their areas into account.
NIWA applies these models in a range of applications from the catchment to country, and from historical conditions to potential future conditions under different land-use or climate change scenarios. The resulting information helps guide freshwater managers and users as well as shedding light on the natural history of New Zealand.
Further information
For further information see the report Surface water components of New Zealand's national water accounts.
Collins, D., Zammit, C., Willsman, A., and Henderson R. (2015). Surface water components of New Zealand’s National Water Accounts, 1995-2014. NIWA client report CHC2015-013, pp. 18.


