Monthly and seasonal river flow information, and our outlook for the coming three months.
February 2010 river flows

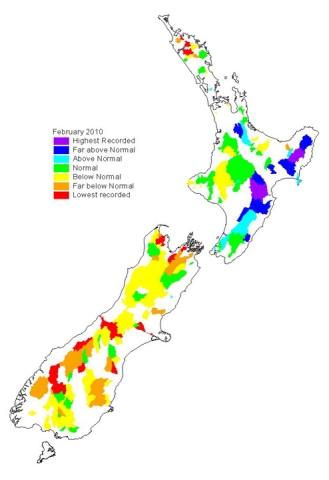
February river flows were below normal throughout much of the South Island, and the north and eastern central North Island. Flows in the East Cape, Hawke's Bay and the southern North Island were above normal. There were some record high flows in the East Cape and the Tararuas.
River flows, December 2009 to February 2010

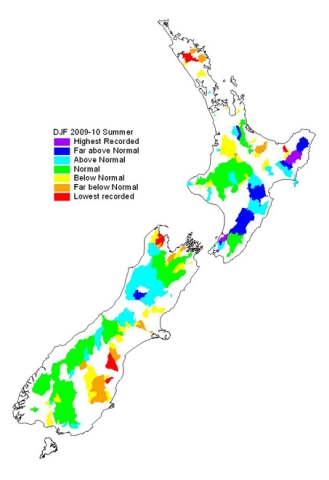
Flows over summer (December '09 to February '10) were above normal on the east coast of the North Island and northern west coast, below normal on the South Island east coast and in Northland, and normal elsewhere.
Outlook by region, March to May 2010
| Northern North Island and eastern South Island | Below normal soil moisture levels and river flows likely. |
| Southeast North Island | Normal soil moisture levels and river flows likely. |
| Southwest North Island and northern South Island | Normal or below normal soil moisture levels and river flows likely. |
| West and south South Island | Normal or above normal soil moisture levels and river flows likely. |
| Eastern South Island | Below normal soil moisture levels and river flows likely. |
Maps and more details of our 3-monthly outlook for river flows, soil moisture, rainfall, and temperature available from NIWA's National Climate Centre.
Our last 3-monthly predictions and what actually happened
What we predicted for December '09 to Feb '10
'River flows are likely to be below normal in the north and east of both islands. In all other regions, river flows are expected to be normal or below normal for the summer season as a whole.
What actually happened
River flows were above normal on the east coast of the North Island and the northern west coast, below normal on the South Island east coast and Northland, and normal elsewhere.
Water resources information provided by NIWA field teams, regional and district councils, and hydropower companies.
Full monthly and seasonal climate summaries are available from NIWA's National Climate Centre
