Climate developments in March 2006

A "double ITCZ" structure, usually only seen during La Niña episodes, was evident in March. One region lay north of the equator from the Caroline Islands extending east across much of the Pacific. Another region extended east, south of the equator, from about the Date Line towards South America. The SPCZ was displaced much further south than average, extending from the Solomon Islands southeast toward New Caledonia, and south of Tonga. This pattern resulted in enhanced convection and/or above average rainfall over parts of the Caroline Islands, the eastern seaboard of Australia, the Solomon Islands, New Caledonia, the Northern Cook Islands, the Marquesas Islands, and the Austral Islands.
An elongated region of suppressed convection (more intense than in February) affected Nauru, Western and Eastern Kiribati, and along the equator east towards South America. Another branch of suppressed convection extended southeast from Tuvalu to Samoa, including Wallis and Futuna, Fiji, northern Tonga, and the Society Islands.
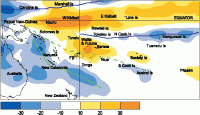
Rainfall was at least 125% of average in the Southern Cook Islands, the Marquesas Islands, and northern New Zealand. In contrast, March rainfall was less than 50% of average in parts of Fiji, northern Tonga, and the Society Islands.
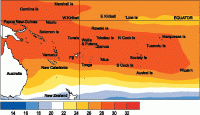
Mean air temperatures were at least 1.0 °C above average in the southern Cook Islands, and more than 1.5 °C above average in parts of central and southern French Polynesia. Many Fiji locations measured record high mean daily maximum temperatures.
Southwest Pacific mean sea-level pressures tended above average between 15-25° S over much of the Southwest Pacific. Equatorial surface easterlies continued to be very persistent along the Equator, occurring in 98% of observations at Tarawa.
| Country | Location | Monthly Rainfall (mm) | % of average | Comments |
|---|---|---|---|---|
| Tonga | Mata’aho Airport | 67 | 23 | Well below normal |
| Fiji | Monasavu | 239 | 35 | Record low |
Soil moisture in March 2006

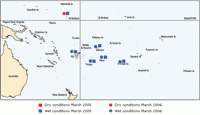
Estimates of soil moisture shown in the map (above) are based on monthly rainfall for one station in each country. Currently there are not many sites in the water balance model. It is planned to include more stations in the future.
The information displayed is based on a simple water balance technique to determine soil moisture levels. Addition of moisture to available water already in the soil occurs by rainfall with losses via evapotranspiration. Monthly rainfall and evapotranspiration is used to determine the soil moisture level and its changes.
Please note that these soil moisture calculations are made at the end of the month.For practical purposes, generalisations were made about the available water capacity of the soils at each site.
At the end of March, above average soil moisture occurred at Nadi, Apia, Nuku'alofa, Hanan, and Rarotonga. Soils were drier than normal at Tarawa. For the same month last year, soils were generally wetter at Tarawa. All the other sites had similar soil conditions at the same time last year.
El Niño/Southern Oscillation (ENSO)


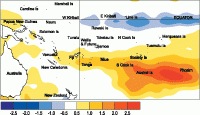
The tropical Pacific continues to exhibit weak La Niña conditions, with negative sea surface temperature (SST) anomalies along the equator east of the Date Line, and generally enhanced trade winds.
For March, the NINO3 SST anomaly was around 0.4°C (-0.4°C for January-March) and NINO4 was also around -0.4°C (-0.5°C for January-March). The region of strongest negative SST anomalies has retreated eastwards in March and has weakened slightly.
A region of significant negative temperature anomalies (-2°C or more) is still present at the sub-surface in the eastern Equatorial Pacific. The Southern Oscillation Index (SOI) was +1.3 for March but the 3-month mean is still less than +1.
Patterns of convection in March were consistent with La Niña conditions: a strong enhancement over Indonesia and northern Australia (with tropical cyclone activity both east and west of the Australian coast), and a suggestion that the SPCZ was displaced southwards; convection was suppressed near the Date Line and a "double ITCZ" structure was evident east of the Date Line. The Madden Jullian Oscillation (MJO) is weak at present.
All model predictions are in the neutral range (mostly on the cool side of neutral) for April-June. Several models suggest warming in the NINO3.4 region later in the year, with one or two predicting El Niño conditions by late 2006. However, there is considerable spread in many sets of model forecasts. The latest NCEP/CPC statement (released 6 April) calls for La Niña conditions during the next 1-3 months. The IRICP summary gives a 53% chance of La Niña conditions through May, reducing to 25% by mid year.
Tropical cyclones
There have been seven tropical cyclones to date in the Southwest Pacific (including the region west of latitude 150 °E). Tropical cyclones in March were Larry (18th-20th) and Wati (19th-24th). Larry, the most severe this season, originated in the Coral Sea, and was very destructive on the Queensland coast of Australia, being reported as the worst tropical cyclone to hit the region in 30 years, with estimated maximum sustained wind speeds of 185 km/h. Gusts to 290 km/h were reported. The Innisfail area, between Cairns and Townsville, was severely affected, high winds producing extensive damage to crops (especially sugar cane and bananas) and property. There was also flooding, and several injuries. 'Wati' affected the open-water region west of Vanuatu, with estimated maximum wind speeds to 150 km/h, and then tracked into the Tasman Sea, bringing high rainfall to northern New Zealand.
There is on average one tropical cyclone occurrence in April. The May issue of the ICU will provide an update on information relating to any occurrences of tropical cyclones in the region.
