Tropical cyclone guidance for the 2005/06 season
Dr Jim Salinger, Stuart Burgess and Dr Jim Renwick

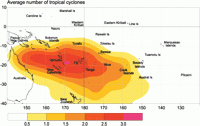
The tropical cyclone season, from November – May, is likely to be near average intensity throughout much of the South Pacific, with a normal frequency of occurrence expected in most areas this season, due to the El Niño/ Southern Oscillation (ENSO) neutral conditions (i.e. no El Niño or La Niña) that are expected to persist in the tropical Pacific over spring and summer (see Figure 1).
For the southwest Pacific, a tropical cyclone is a tropical low-pressure system, intense enough to produce sustained gale force winds (at least 34 knots or 63 km/h). A "severe tropical cyclone" produces sustained hurricane force winds (at least 64 knots or 118 km/h), and corresponds to the hurricanes in the North Atlantic and typhoons of the North Pacific. Southwest Pacific tropical cyclones are grouped into classes ranging from 1 to 5, with 5 being the strongest. On average, four per season reach at least class 4, with mean wind speeds of at least 64 knots or 118 km/h, while two usually reach class 5, with mean speeds in excess of 90 knots or 167 km/h.
In the USA, Hurricanes Katrina and Rita both reached class 5, their maximum sustained winds speeds reaching at least 135 knots or 250 km/h. In the 2004/05 season in the South Pacific, Cyclones Meena, Nancy, Olaf and Percy, which battered the Cook Islands, all reached at least class 4 in strength or higher. These were very destructive to Samoa and the Cook Islands.
About nine tropical cyclones on average can be expected over the entire Southwest Pacific region in an ENSO-neutral season. Tropical sea surface temperatures, which play an important role in the development of tropical cyclones, are presently above average over the seas to the north and east of the Date Line, but are near average elsewhere. In the Southwest Pacific, tropical cyclones usually develop in the wet season, from November through April, but there can also be an occasional occurrence in May. Peak cyclone occurrence is usually during January, February and March.
In previous seasons similar to the present, several tropical cyclones usually occur (red) in the region around Vanuatu, New Caledonia, and the adjacent Coral Sea, some affecting other areas. For the entire region there is a 70% chance that at least one tropical cyclone will occur before 1 January, increasing to 97% by 1 February. About half of the tropical cyclones that develop reach hurricane force having mean wind speeds of at least 64 knots (118 km/h).
For further information: In the Pacific Islands - contact your local Meteorological Service
The full season: November to May
The following table shows the average number of tropical cyclones passing within 5° (550 km circle) of the main island groups of the Southwest Pacific over the full November through May period. Based on 35 years of data, and for tropical cyclones having mean wind speeds over 34 knots.
| Country | Average over Neutral ENSO years | Average over all years | Comment |
|---|---|---|---|
| Fiji | 2.4 | 2.3 | Average risk |
| Tonga | 2.3 | 2.1 | Average risk |
| Niue | 2.0 | 1.9 | Average risk |
| Vanuatu | 2.8 | 3.0 | Average risk |
| New Caledonia | 2.9 | 2.8 | Average risk |
| Wallis and Futuna | 1.8 | 1.7 | Average risk |
| Southern Cook Islands | 1.4 | 1.4 | Average risk |
| Samoa | 1.3 | 1.4 | Average risk |
| Tuvalu | 1.0 | 1.1 | Average risk |
| Northern New Zealand | 0.7 | 1.0 | Average risk |
| Southern Papua New Guinea | 0.5 | 0.6 | Average risk |
| Tokelau | 0.5 | 0.7 | Average risk |
| Society Islands | 0.6 | 0.8 | Average risk |
| Austral Islands | 0.5 | 0.8 | Average risk |
| Tuamotu Islands | 0.2 | 0.4 | Average risk |
| Pitcairn Island | 0.1 | 0.3 | Average risk |
| Solomon Islands | 0.9 | 1.4 | Cyclones still likely |
| Northern Cook Islands | 0.3 | 0.8 | Cyclones still possible |
| Marquesas Islands | >0.1 | 0.1 | Cyclones unlikely |
