
Choosing the right number of eDNA replicates
Knowing how many eDNA replicates to collect is one of the biggest factors influencing both the cost and confidence of a survey. The national standard of six-replicates provides a robust and consistent assessment of stream fish communities and remains the preferred approach for regulatory reporting, consent monitoring, and situations where missing a species could have important management consequences.
Through research funded and supported by DairyNZ, we examined when fewer replicates can provide results comparable to the six-replicate standard, and how stream characteristics influence that confidence. The results showed that smaller streams and lower-risk applications can often be assessed with fewer replicates, while larger and more complex waterways generally benefit from higher sampling effort.
This decision-support tool translates those findings into a practical guide to help match your sampling effort to your objectives, stream characteristics, and budget. It identifies situations where reduced replication could still provide useful results, and where the standard six-replicate approach should be retained.
Download: Comparison of the eFIBI using 6-replicate vs n-replicate eDNA samples [PDF 2MB]
Use the tool
Step 1 – What's the purpose of your sampling?
☐ Regulatory or compliance (NPSFM, resource consent, council reporting) → Use 6 replicates
☐ Monitoring rare, threatened, or invasive species → Use 6 replicates
☐ Calculating a fish community metric (species richness or eFIBI) for a formal report → Use 6 replicates
☐ Broad‑scale check of fish species richness for non‑regulatory and non‑compliance purposes only → 2–5 replicates may be sufficient
☐ General curiosity — "what fish are in my stream?" → 2–5 replicates may be sufficient
* One-replicate eDNA samples are not recommended for estimating species richness or calculating eFIBI scores, as they consistently underestimate both.
Step 2 – What kind of stream are you sampling?
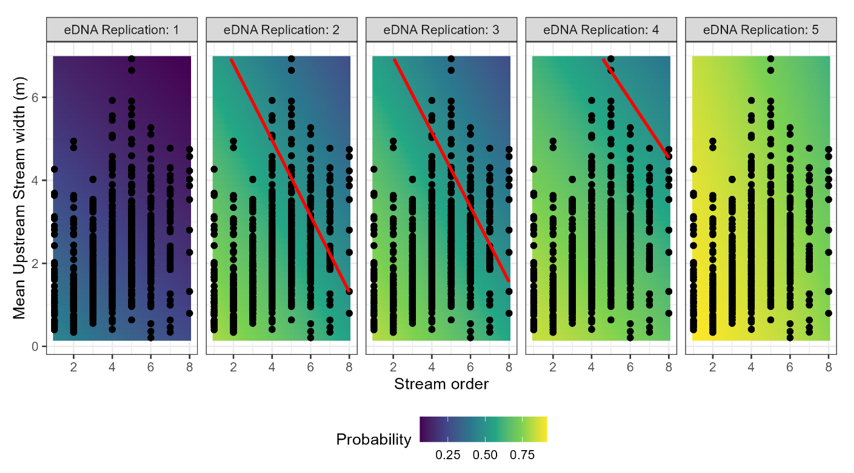
The graph below shows how stream size influences the number of eDNA replicates needed to achieve confidence comparable to a standard six‑replicate survey. Use the stream order (horizontal axis) and mean stream width (vertical axis) to locate your stream on the graph.
The red line marks a 50% probability of agreement with the six‑replicate reference survey. Streams that fall in the lower left of the red line have a higher likelihood of producing comparable results using fewer replicates, whereas streams that fall in the upper right of the red line are less likely to match the six‑replicate standard and should preferentially increase replication effort.
The coloured background shows the probability of agreement, with warmer colours (green to yellow) indicating greater confidence and cooler colours (blue to purple) indicating lower confidence. In general, small, low‑order streams can often be sampled with fewer replicates, while larger, wider, and more complex streams require additional replication to achieve the same level of confidence.
How to use the graph: Start with the replication level you are considering and locate your stream using its stream order and width. If the point falls in the upper right of the red line, consider increasing the number of replicates and move to the next panel. Continue until the point falls in the lower left of the red line, indicating that the chosen replication level is likely to provide a result comparable to the six‑replicate standard.
Step 3 – Check your eFIBI result (if calculated)
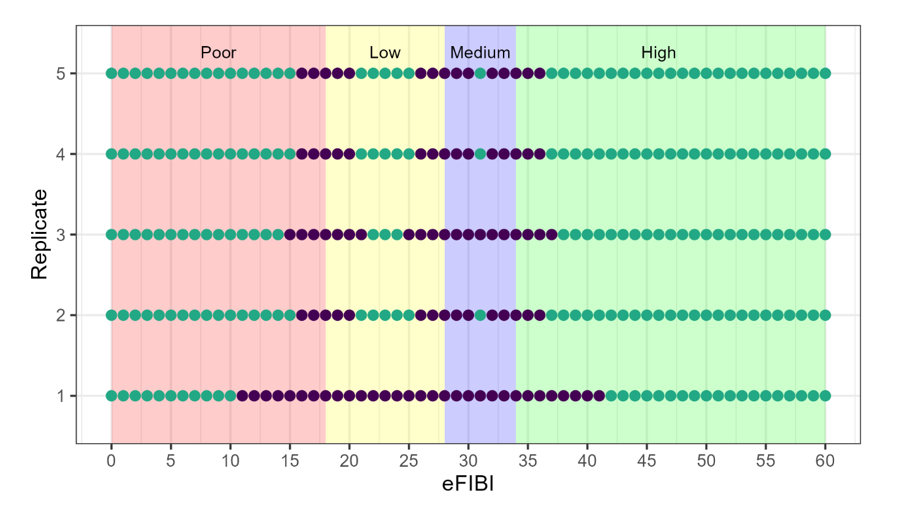
The graph below shows the range of eFIBI scores where reduced‑replicate surveys may lead to uncertainty in the assigned eFIBI condition band. Locate your eFIBI score on the horizontal axis and the number of replicates collected on the vertical axis.
Purple points identify scores where uncertainty overlaps one of the eFIBI thresholds used to define Poor, Low, Medium, and High condition classes. If your result falls on a purple point, the eFIBI score is close enough to a classification boundary that a different number of replicates could potentially change the condition band assigned to the site. In these situations, the result should be interpreted with caution and additional replicates may be warranted.
Green points indicate scores where the uncertainty does not overlap an eFIBI threshold and the assigned condition class is less likely to change because of replication effects.
How to use the graph: Find your eFIBI score and move up to the row corresponding to the number of replicates collected. If the point falls within a purple zone, consider collecting additional replicates or confirming the result with a higher replication effort. If the point falls within a green zone, the assigned eFIBI condition class is likely to be robust to the level of replication used.
⚠️ Important note about eFIBI condition bands
The eFIBI condition bands (Poor, Low, Medium and High) shown here are based on the categories currently used in the National Policy Statement for Freshwater Management (2020) (NPSFM 2020). These thresholds were originally developed from fish communities surveyed using conventional capture methods, not eDNA. As a result, eDNA surveys can sometimes produce higher eFIBI scores than conventional sampling, particularly in species‑rich streams. Consequently, the bands remain useful for interpretation of eFIBI but should be viewed as estimates. See Mahlum and Baker (2026) for further discussion.
Quick reference table
| Purpose | Small stream (1st–3rd order) | Larger stream (4th order+) |
| NPSFM / consent reporting | 6 replicates | 6 replicates |
| Rare / threatened / invasive species | 6 replicates | 6 replicates |
| Formal eFIBI or species richness | 6 replicates | 6 replicates |
| Broad‑scale check of fish species richness for non-regulatory and non-compliance reporting | 2–3 replicates | 3–5 replicates |
| General "what's here?" survey | 2–3 replicates | 3–5 replicates |
| One‑off screening | Not recommended <2 | Not recommended <3 |
A note on interpretation
Fewer replicates lower the cost of sampling but increase the chance of misclassifying stream condition, particularly near eFIBI category thresholds. Whenever a result matters for a management decision, err on the side of more replicates.
What is stream order?
Stream order is a simple way of describing how big a stream is based on where it sits in the network.
- A 1st order stream is the smallest — a headwater with no tributaries flowing into it (think of a small farm drain or a spring‑fed trickle at the top of a catchment).
- When two 1st order streams join, they form a 2nd order stream.
- Two 2nd order streams joining make a 3rd order, and so on.
- Most farm streams are 1st to 3rd order. Larger rivers like the Waikato or Clutha are 6th order or higher.
In short: the higher the number, the bigger the stream and the more water flowing through it.