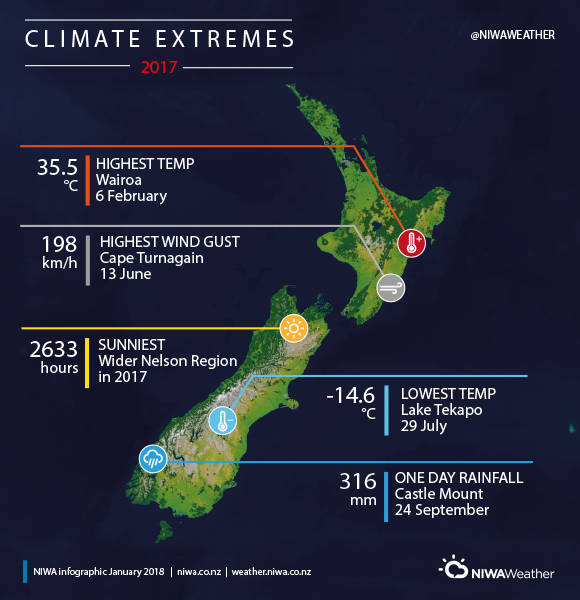
2017: A year of weather extremes across New Zealand
|
Temperature |
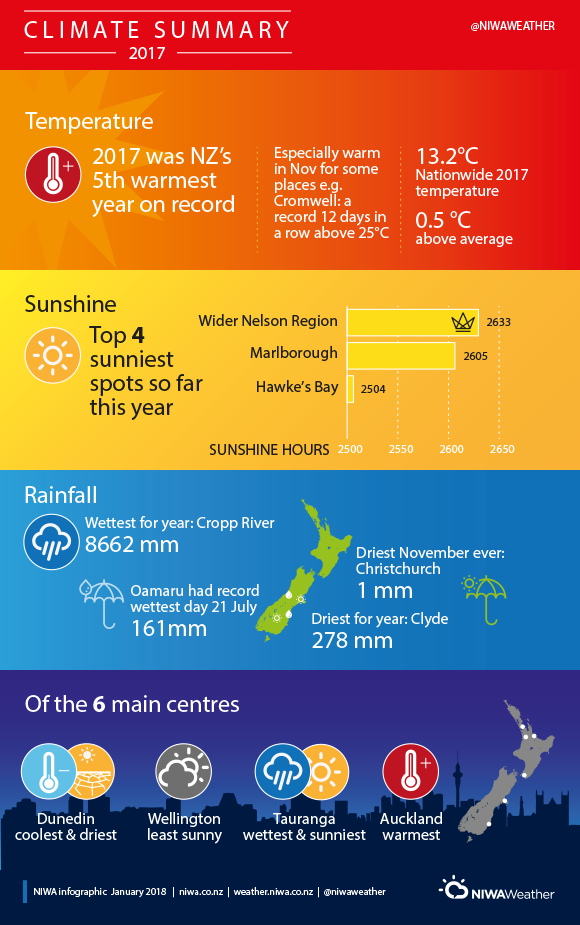
Annual temperatures were near average (within 0.5°C of the annual average) for much of the South Island and lower and western North Island. Above average temperatures (>0.50°C above the annual average) occurred in the Bay of Plenty, Gisborne, Hawke’s Bay and in parts of Northland, Waikato, Manawatu-Whanganui, Nelson, Marlborough, Buller, upper Canterbury, interior Otago, and along the West Coast. 2017 was the 5th warmest on record for New Zealand, based on NIWA’s seven-station series which began in 1909. |
|
Rainfall |
Yearly rainfall in 2017 was above normal (120-149% of the annual normal) for parts of Auckland, Waikato, Bay of Plenty, coastal Canterbury, and north coastal Otago. In contrast, rainfall was below normal (50-79% of the annual normal) in much of Southland and interior Otago. Rainfall was near normal (80 to 119% of the annual normal) for the remainder of New Zealand. |
|
Soil moisture |
The start to 2017 had below or well below normal soil moisture in the northern and eastern North Island, which was then alleviated by several rainstorms that occurred from mid-February through April. During April, above normal soil moisture developed in the eastern South Island and persisted through much of the winter and spring. From October through the end of the year, below normal soil moisture levels occurred in the western South Island from the development of La Niña. Very low rainfall during November and December led to below or well below normal soil moisture nationwide. 11 of New Zealand’s 16 geographical regions experienced meteorological drought, according to the New Zealand Drought Index by the end of the year. |
|
Sunshine |
Annual sunshine was mainly near normal (90-109% of the annual normal) or above normal (110-124% of the annual normal) throughout New Zealand. The wider Nelson region experienced New Zealand’s highest annual sunshine total during 2017 (2633 hours). |
Overview
Annual mean sea level pressures for 2017 were slightly higher than normal to the south and east of New Zealand, primarily over and to the east of the Chatham Islands. This atmospheric pressure pattern produced slightly more northerly wind flows than normal for the year as a whole. Many months were characterised by high pressure anomalies either east or south of New Zealand, with the months of January and September 2017 being notable exceptions. The last quarter of the year was marked by easterly flow anomalies over the country and progressively increasing temperature anomalies, ending with the second warmest December on record.
Sea surface temperatures (SSTs) around New Zealand were below normal during the beginning of 2017, but rebounded to near or above average levels during mid-2017. From November into December, a “marine heatwave” was observed across the Tasman Sea and in New Zealand coastal waters when SSTs were 2°C to 4°C above average. La Niña conditions in the equatorial Pacific quickly faded to neutral at the beginning of 2017 and remained neutral through much of the year. Then, in November-December 2017, La Niña conditions re-emerged in the tropical Pacific Ocean and were accompanied by higher than normal air pressure across New Zealand.
During 2017, temperatures were near average (within 0.5°C of the annual average1) across much of the South Island and lower and western North Island. Above average temperatures (0.51°C to 1.20°C above the annual average) occurred in Bay of Plenty, Gisborne, Hawke’s Bay and in parts of Northland, Waikato, Manawatu-Whanganui, Nelson, Marlborough, Buller, upper Canterbury, interior Otago, and along the West Coast. Several locations, particularly in the North Island, observed record or near-record high mean, mean maximum, and mean minimum temperatures.
From month-to-month, January saw a nationwide temperature 0.7°C below the long-term average. This was the only month of the year that had below average temperatures. Five months, including February, March, May, June and July, had near average temperatures (-0.5°C to 0.5°C of the 1981–2010 monthly average). Six months, including April (0.7°C above average), August (1.3°C above average), September (0.7°C above average), October (1.0°C above average), November (1.1°C above average), and December (2.4°C above average) recorded above average temperatures. The warmer than average run between August and October was the warmest-equal August-October period (equal with 1988) on record since 1909 for New Zealand using the NIWA’s seven-station temperature series.
The nation-wide average temperature for 2017, calculated using stations in NIWA’s seven-station temperature series, was 13.15°C (0.54°C above the 1981–2010 annual average). The four years 2016, 2013, 1999, and 1998 were warmer than 2017 according to the NIWA seven-station series, thus making 2017 the 5th warmest on record.
For rainfall, 2017 was a year of two halves. The year started off on a rather wet and stormy note for the South Island in January, a theme that expanded to include the North Island during March and April as the “Tasman Tempest”, Ex-Tropical Cyclone Debbie, and Ex-Tropical Cyclone Cook contributed to record or near-record amounts of rain and flooding for some areas. Drought conditions in Northland during February were quickly erased due to these storms. During late 2017, significant dryness emerged about the South Island and the lower North Island. Christchurch observed 1 mm of rain during November, the driest November on record. By the end of the month, the city had a 35-day dry spell, which increased to 47 days before ending in December. Oamaru also recorded its driest November on record (6 mm), just four months after observing its wettest July on record (224 mm of rain fell), which also happened to be its second wettest month, overall, on record. Furthermore, Oamaru recorded its wettest winter on record during 2017. During December, meteorological drought emerged in the western and lower North Island around the Wellington-Wairarapa region following a near-record 30-day dry spell in Wellington city. The drought was then classified by MPI as a medium-scale adverse event in Taranaki and western parts of the Manawatu-Whanganui region and in Wellington.
By the end of September 2017, all six main centres had already recorded their normal annual rainfall. However, a drier than normal end to the year meant that only a handful of locations saw record or near-record rainfall for the year as a whole.
Annual rainfall totals for 2017 were above normal (120-149% of the annual normal) for parts of Auckland, Waikato, Bay of Plenty, and coastal Canterbury, and north coastal Otago. In contrast, rainfall was below normal (50-79% of the annual normal) in most of Southland, interior Otago, and in the Southern Alps. Rainfall was near normal (80 to 119% of the annual normal) for the remainder of New Zealand.
It was an especially wet year in Oamaru which had its 2nd wettest year on record (813 mm of rain). On 21 July, 161 mm of rain fell, making it the wettest day in the town on record since records began in 1950; thereafter, Oamaru recorded just 163 mm during the following five months combined (August-December 2017). Meanwhile, Tiwai Point (Southland) had its driest year on record (731 mm of rain recorded at that site).
Soil moisture levels began the year drier than normal across much of the North Island, particularly in Northland, following a dry end to 2016 and start to 2017. Early in February, Northland’s dry conditions were classified as a medium-scale adverse event under MPI’s Primary Sector Recovery Policy. A heavy rain event in mid-February relieved soils of their significant dryness there, and this was followed by several more rainstorms (including rain from ex-tropical cyclones) during March and April. During November 2017, very dry weather across the country led to major decreases in soil moisture, especially across the South Island and lower North Island. This led to the issuing of a ban on residential sprinklers and irrigation systems in the Wellington area. Dry conditions persisted during December and led to the emergence of meteorological drought in Wellington-Wairarapa, Manawatu-Whanganui, and Taranaki. Thus, water restrictions were put in place across the western and lower North Island as well as Tasman, Nelson, parts of Otago, the Coromandel, the Bay of Plenty, and Hawke’s Bay.
Annual sunshine was mainly near normal (90-109% of the annual normal) or above normal (110-124% of the annual normal) throughout New Zealand. The greater Nelson region experienced New Zealand’s highest annual sunshine total during 2017 (2633 hours).
1 Note all temperature, rainfall and sunshine anomalies reported in this document are relative to the 1981-2010 average/normal.
Download
Download the 2017 New Zealand Annual Climate Summary [PDF 1.6MB]
