01 September 2008

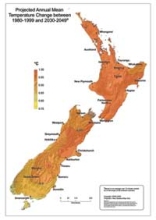
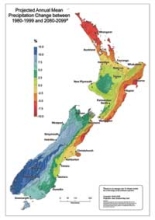
NIWA’s National Climate Centre has produced a set of five A1-size maps displaying some of our new climate change projections for New Zealand.
The maps present a ‘middle-of-the-road’ picture of the future. They show the average projection from 12 global climate models for a mid-range greenhouse gas emission scenario.


The full set shows:
- change in mean annual temperature by about the middle of this century
- change in mean annual temperature by about the end of this century
- percentage change in mean annual precipitation by about the middle of this century
- percentage change in mean annual precipitation by about the end of this century
- percentage change in mean precipitation by season(four panels show winter, spring, summer, autumn) by about the end of this century.
Available from NIWA for $30 (incl P&P within NZ) for the set of five maps.
To order a copy: www.niwa.co.nz/pubs/series/posters [email protected] 0800 RING NIWA (0800 746 464)
