Campbell Gardiner explains how hundreds of lines of computer code generated each week are helping biosecurity authorities keep a close eye on a plant pathogen.
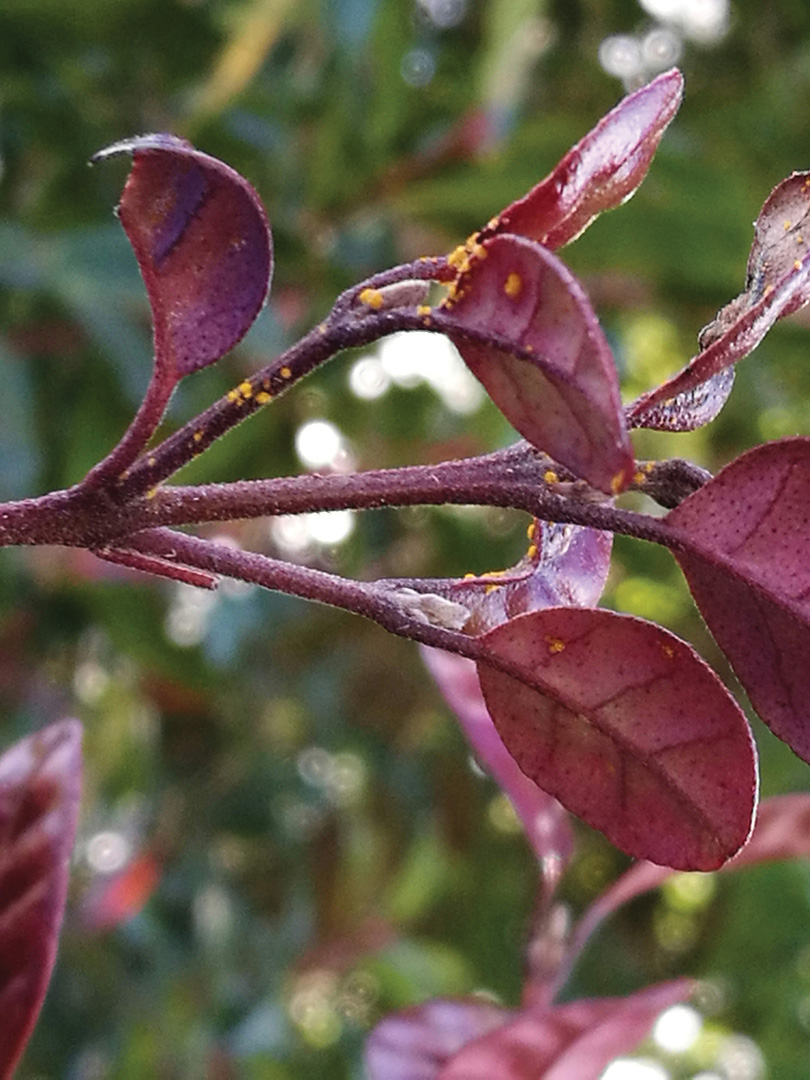
The fungal disease myrtle rust attacks a wide variety of plants in the myrtle family and spreads easily, particularly through windborne spores. Species at risk include natives such as pōhutukawa, rātā, mānuka and ramarama along with commercially valuable exotics such as eucalyptus and feijoa.
The disease has affected more than 350 myrtle species since its arrival in Australia in 2010 and was first detected on mainland New Zealand just over three years ago. It has never been successfully eradicated in any country and, despite early attempts to contain it here, it has quickly spread through the North Island and the top of the South.
To date, the native shrub ramarama appears most susceptible, but its full impact on other species is still unclear, and Ministry for Primary Industries (MPI) biosecurity teams are monitoring its progress closely.
This is where NIWA comes into play, because myrtle rust’s powdery yellow spores travel large distances by wind, and the infection risk is very dependent on climate conditions.
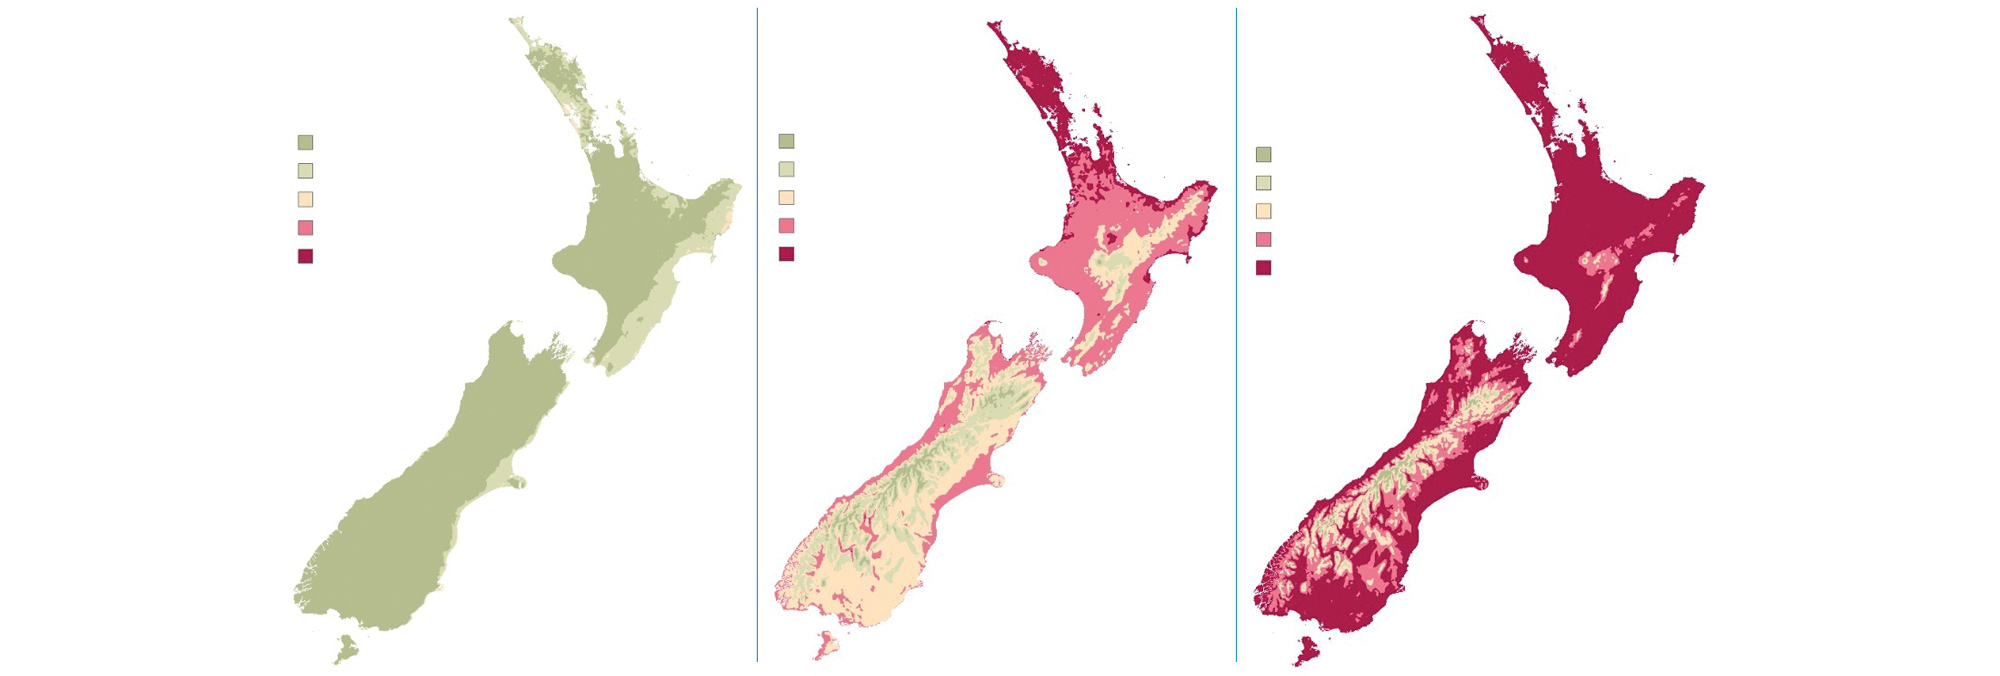
Over the past three years, NIWA researchers have combined climate forecasting capability with GIS (Geographic Information Systems) technology to produce weekly maps for MPI, showing myrtle rust infection, spore formation and latency period.
Each Monday, NIWA Wellington-based climate GIS technician Vijay Paul runs an automated script that generates the maps. Data for the maps comes from the NZCSM – an ultra-high-resolution weather prediction model powered by NIWA’s supercomputers.
Initially, Vijay was running his script manually and making the maps available to MPI through logins to a walled-off section of NIWA’s GIS server. MPI then needed to take additional steps to embed the maps into their systems.
But after putting his head together with NIWA GIS data analyst Dr Tilmann Steinmetz, Vijay figured out a more interactive way to share the information. This involves using NIWA’s ArcGIS Enterprise Portal and ArcGIS Online and means MPI now has online, interactive versions of the maps to help plot and predict the spread of the disease.
“My script publishes all the raster layers into the ArcGIS Portal. There’s a group within the portal that is synced to ArcGIS Online, which itself has another group, including MPI staff. They automatically access the maps each Monday.”
NIWA is contracted by Plant & Food Research to do the mapping work. It’s part of a myrtle rust collaboration between Plant & Food, MPI and NIWA that last year picked up a NZ Bio-Protection Research Centre science award.
When myrtle rust was first detected here, NIWA also helped with aerial dispersal modelling – forecasting the trajectories of spores from Australia and modelling the spread within New Zealand.
This article forms part of Water & Atmosphere July 2020, read more stories from this series.