A weekly update describing soil moisture patterns across the country to show where dry to extremely dry conditions are occurring or imminent. Regions experiencing significant soil moisture deficits are deemed “hotspots”. Persistent hotspot regions have the potential to develop into drought.
The next Hotspot Watch will be issued in early January.
Facts: soil moisture
In the North Island, a series of rainbands as well as isolated thunderstorms led to moderate-to-heavy rain totals being observed for most areas, with very heavy rain for parts of Taranaki, Tararua Range, the Central Plateau and the western Raukumura and Te Urewera Ranges. While the mountain ranges picked up the greatest totals, significant rainfall totals were also found in other places, such as Stratford which recorded 184 mm of rainfall in the last week, Te Puke 160 mm and Tūrangi 134 mm. The normal west-east divide of rainfall wasn’t as pronounced as last week, with over 100 mm recorded in parts of the Wairarapa and even 69 mm recorded at Napier, or about 1.5 times their December monthly normal. This led to widespread soil moisture increases across most of the North Island, with particularly large increases about the Bay of Plenty, parts of Waikato, Auckland and Northland. The driest soils across the North Island, when compared to normal for this time of the year, are found in pockets around the Bay of Plenty, southern Coromandel and coastal Whangārei, while the wettest soils for this time of year are found from Wellington to about the Manawatū or Rangitikei region.
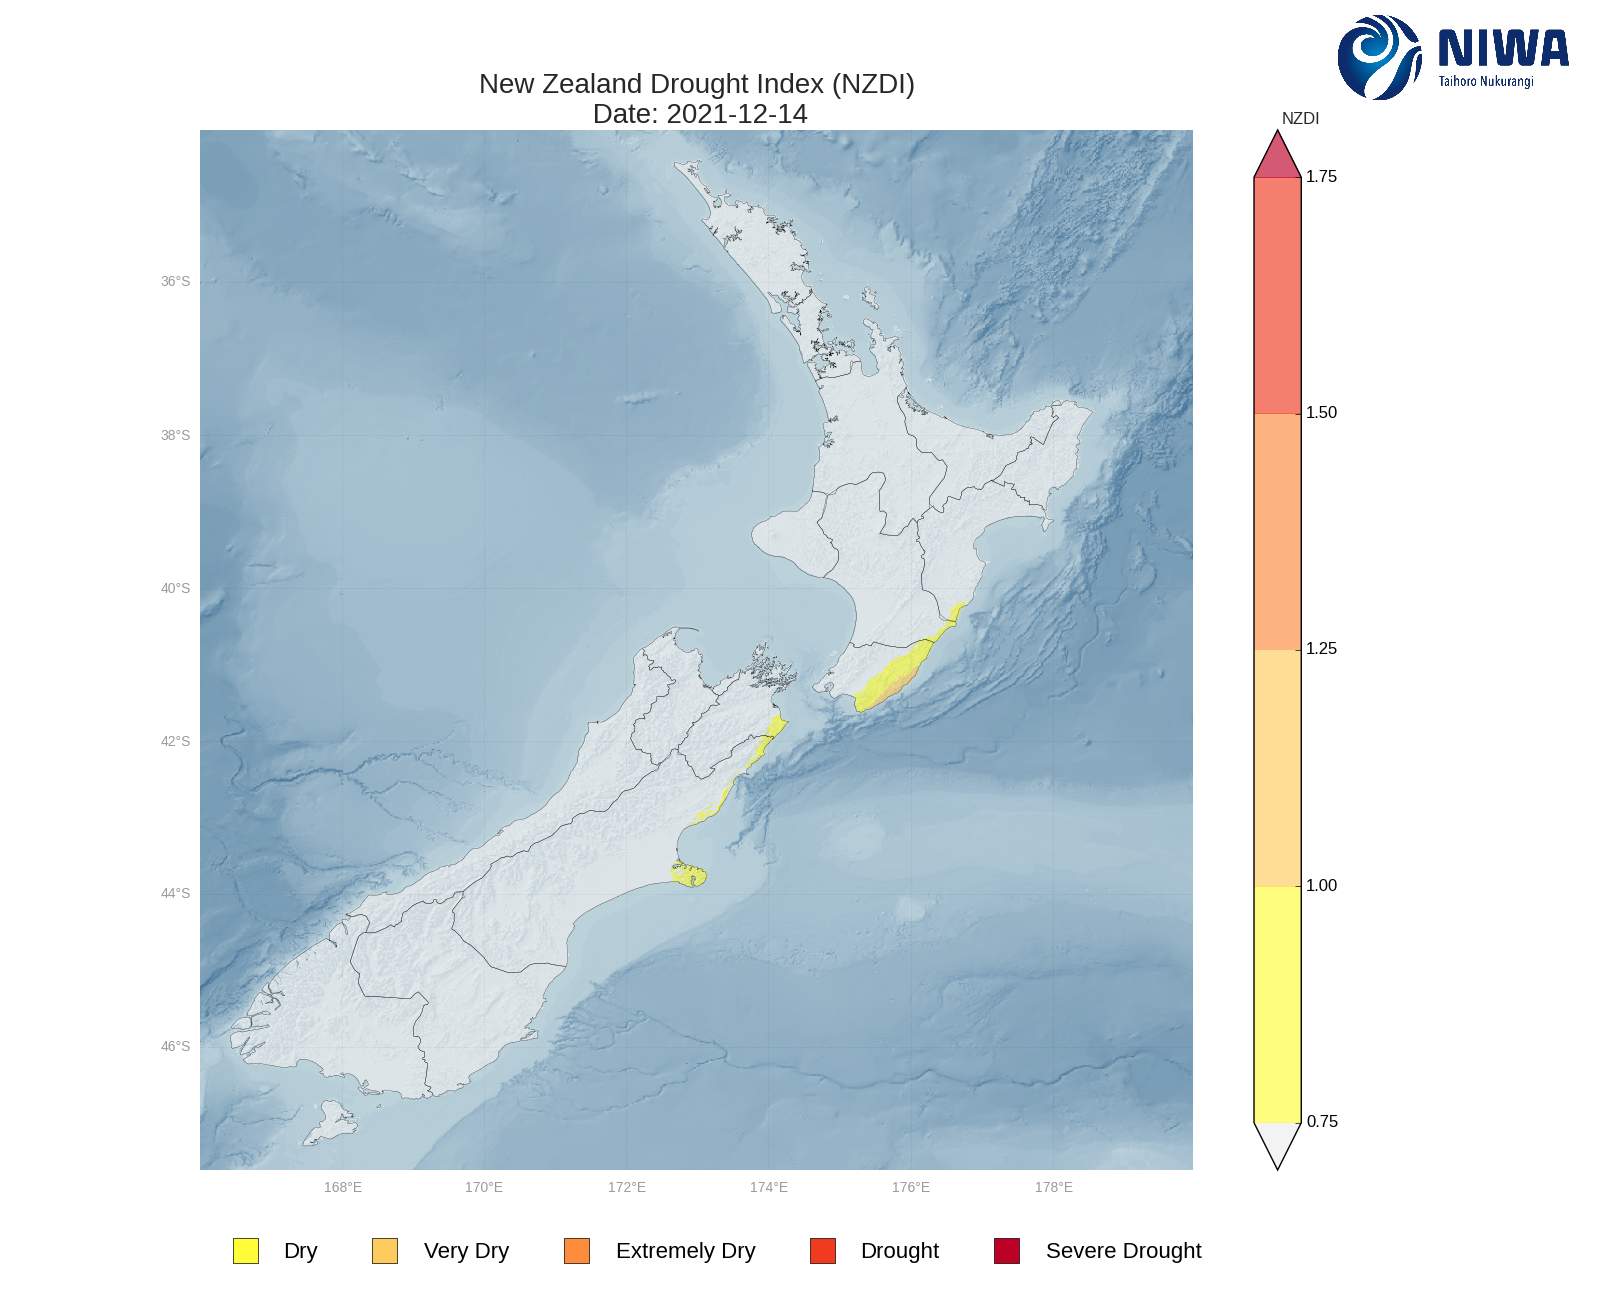
During the past week, hotspots that recently formed in southern Northland, northern Auckland, near Whakatāne, and southern Hawke’s Bay have all dissipated. The New Zealand Drought Index (NZDI) map below shows that dry and very dry conditions are located in Wairarapa as of 14 December.
In the South Island, moderate-to-heavy rainfall was observed from Canterbury to the West Coast and extending up to the top of the South Island. On Wed 15, an entire month’s worth of rain fell to parts of the Canterbury region, including Christchurch where broadly 50-80 mm was recorded. In contrast, only light rain fell in the Mackenzie region, most of Otago and Southland over the last week. Invercargill recorded a completely dry week while Gore only picked up 3 mm of rainfall. This resulted in some soil moisture increases for parts of the northern South Island, modest decreases or no changes for the western and middle of the South Island, and soil moisture decreases for the southern South Island. The driest soils in the South Island, when compared to normal for this time of year, are located in coastal southern Southland, including Invercargill. The wettest soils for this time of year are found near Farewell Spit and about the Marlborough Sounds.
No hotspots are currently observed in the South Island. However, the New Zealand Drought Index (NZDI) map below shows that dry conditions are located from coastal Marlborough to central coastal Canterbury as of 14 December. This may respond to recent rainfall in these areas.
Outlook and soil moisture
In the North Island, the next week looks to be much drier and settled than last. A few showers may bring light-to-moderate rainfall totals on Friday (17 December) to the west, but this should mostly clear on Saturday. Areas of rain and showers may develop on Tuesday or Wednesday, but at this stage totals look light. Some eastern areas of the North Island may experience a completely dry week, while areas in the west and those about the ranges may only receive 5-20 mm of total rainfall.
Due to the expected rainfall in the next week, soil moisture levels are likely to decrease for most of the North Island. A re-emergence of small hotspots are possible in Northland and around the Coromandel.
In the South Island, moderate rain should impact Fiordland and the West Coast on Sunday (19 December), with another burst of moderate-to-heavy rain affecting similar areas on Monday through Wednesday. Areas east of the divide or even about the upper Marlborough and Nelson may experience a largely dry week, with totals of 20 mm or less. Meanwhile parts of the West Coast and Fiordland may see as much as 100-300 mm.
Due to the expected weekly rainfall, modest soil moisture increases will be likely across the western parts of the South Island. Soil moisture decreases are likely in eastern areas. A small hotspot may form about southern coastal Southland.
Background:
Hotspot Watch: a weekly advisory service for New Zealand media. It provides soil moisture and precipitation measurements around the country to help assess whether extremely dry conditions are imminent.
Soil moisture deficit: the amount of water needed to bring the soil moisture content back to field capacity, which is the maximum amount of water the soil can hold.
Soil moisture anomaly: the difference between the historical normal soil moisture deficit (or surplus) for a given time of year and actual soil moisture deficits.
Definitions: “Extremely” and “severely” dry soils are based on a combination of the current soil moisture status and the difference from normal soil moisture (see soil moisture maps).
Hotspot: A hotspot is declared if soils are "severely drier than normal" which occurs when Soil Moisture Deficit (SMD) is less than -110 mm AND the Soil Moisture Anomaly is less than -20 mm.
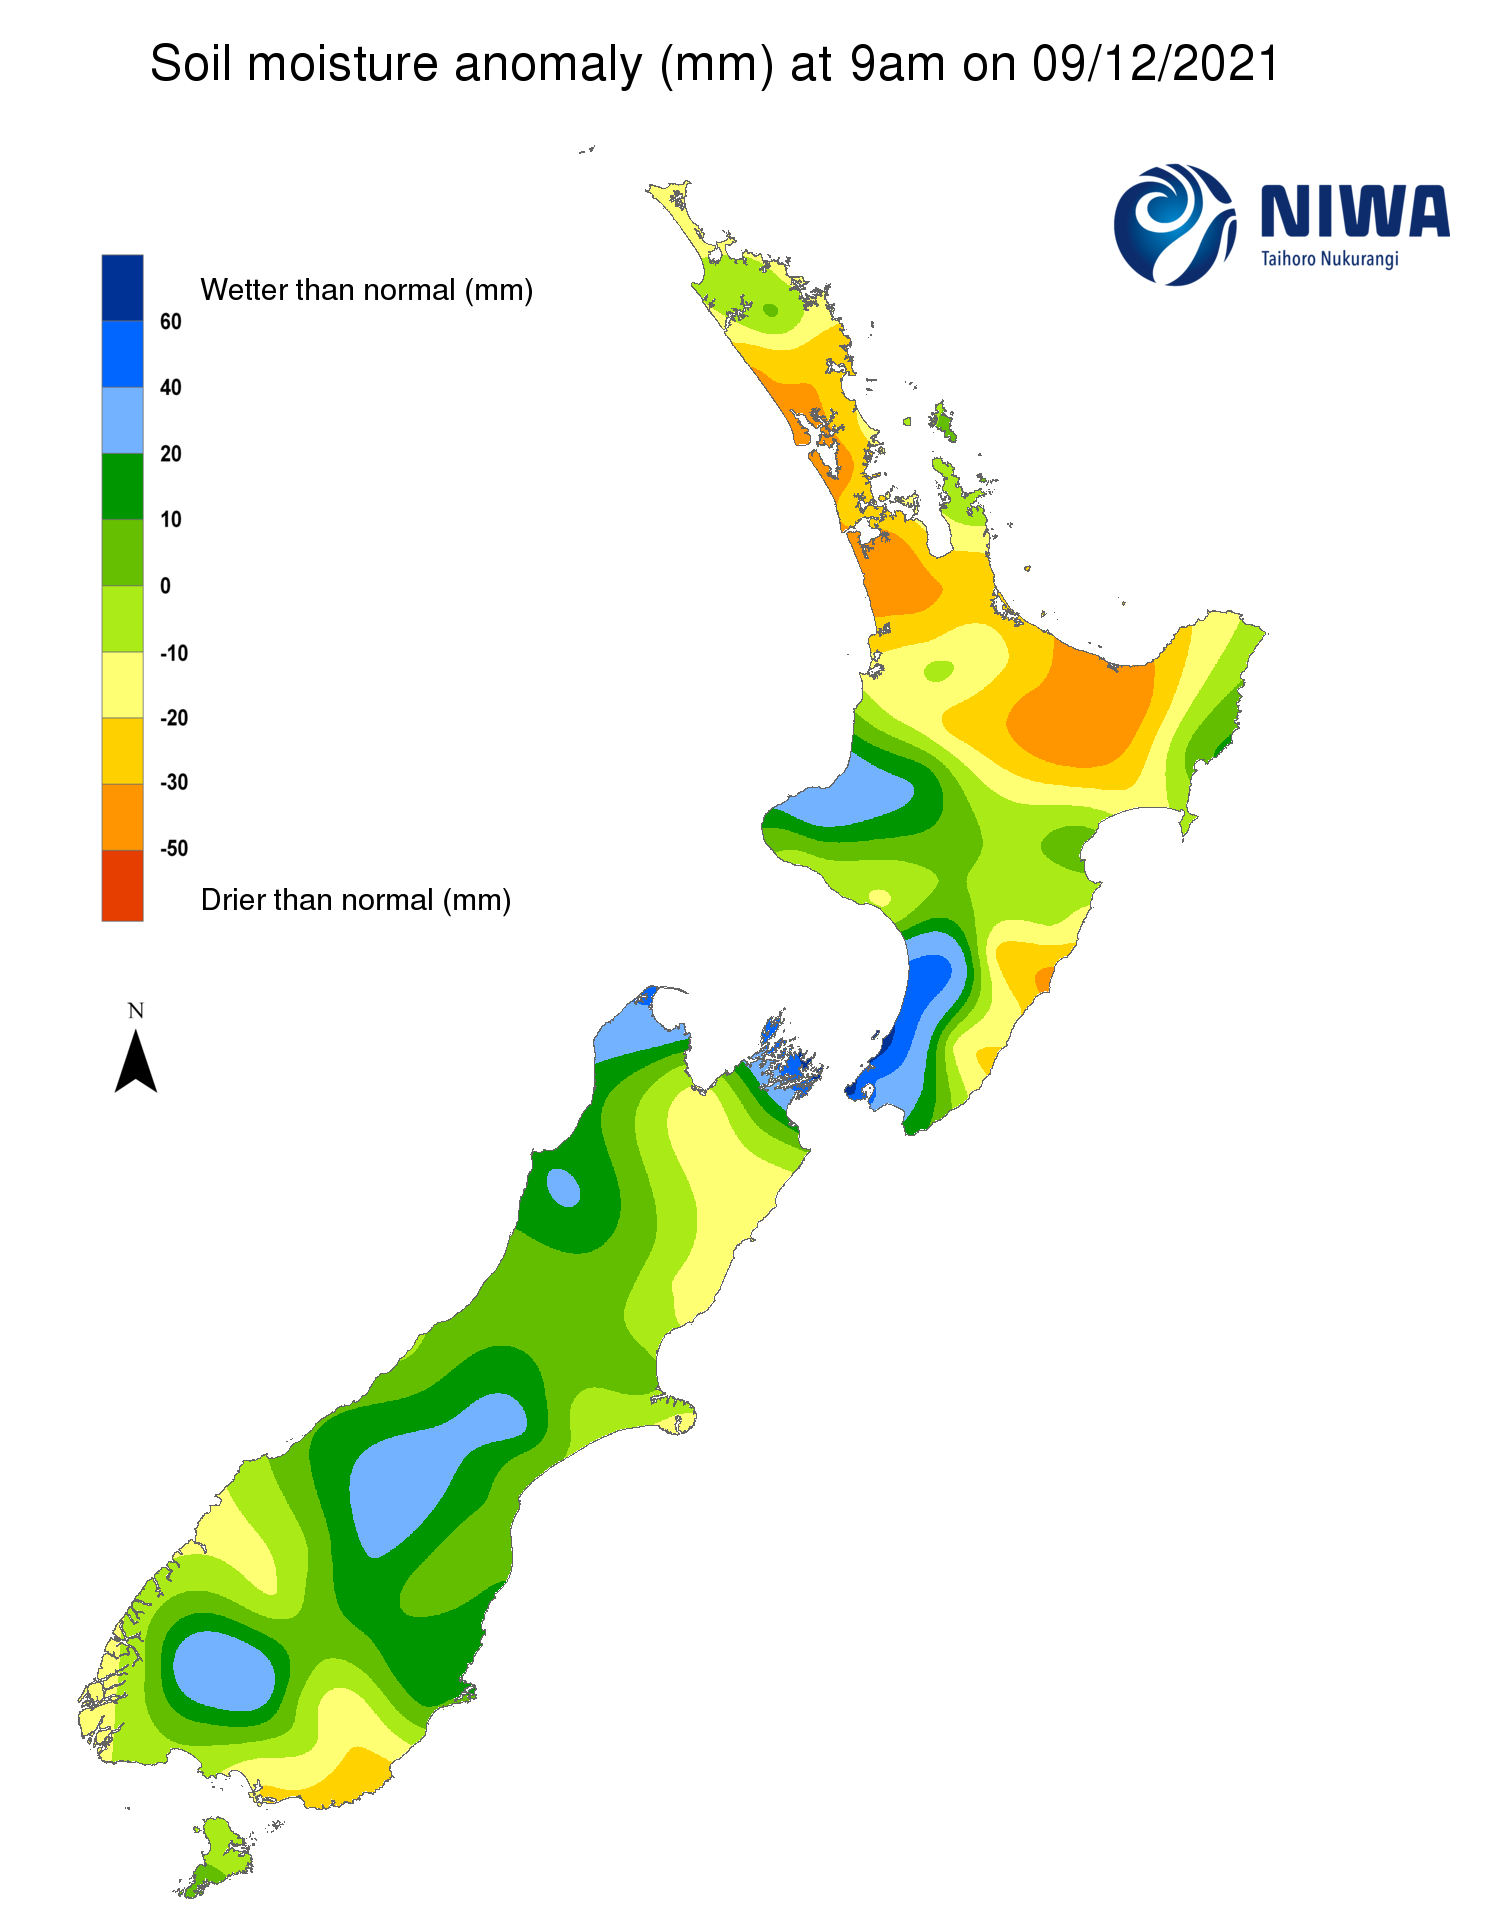
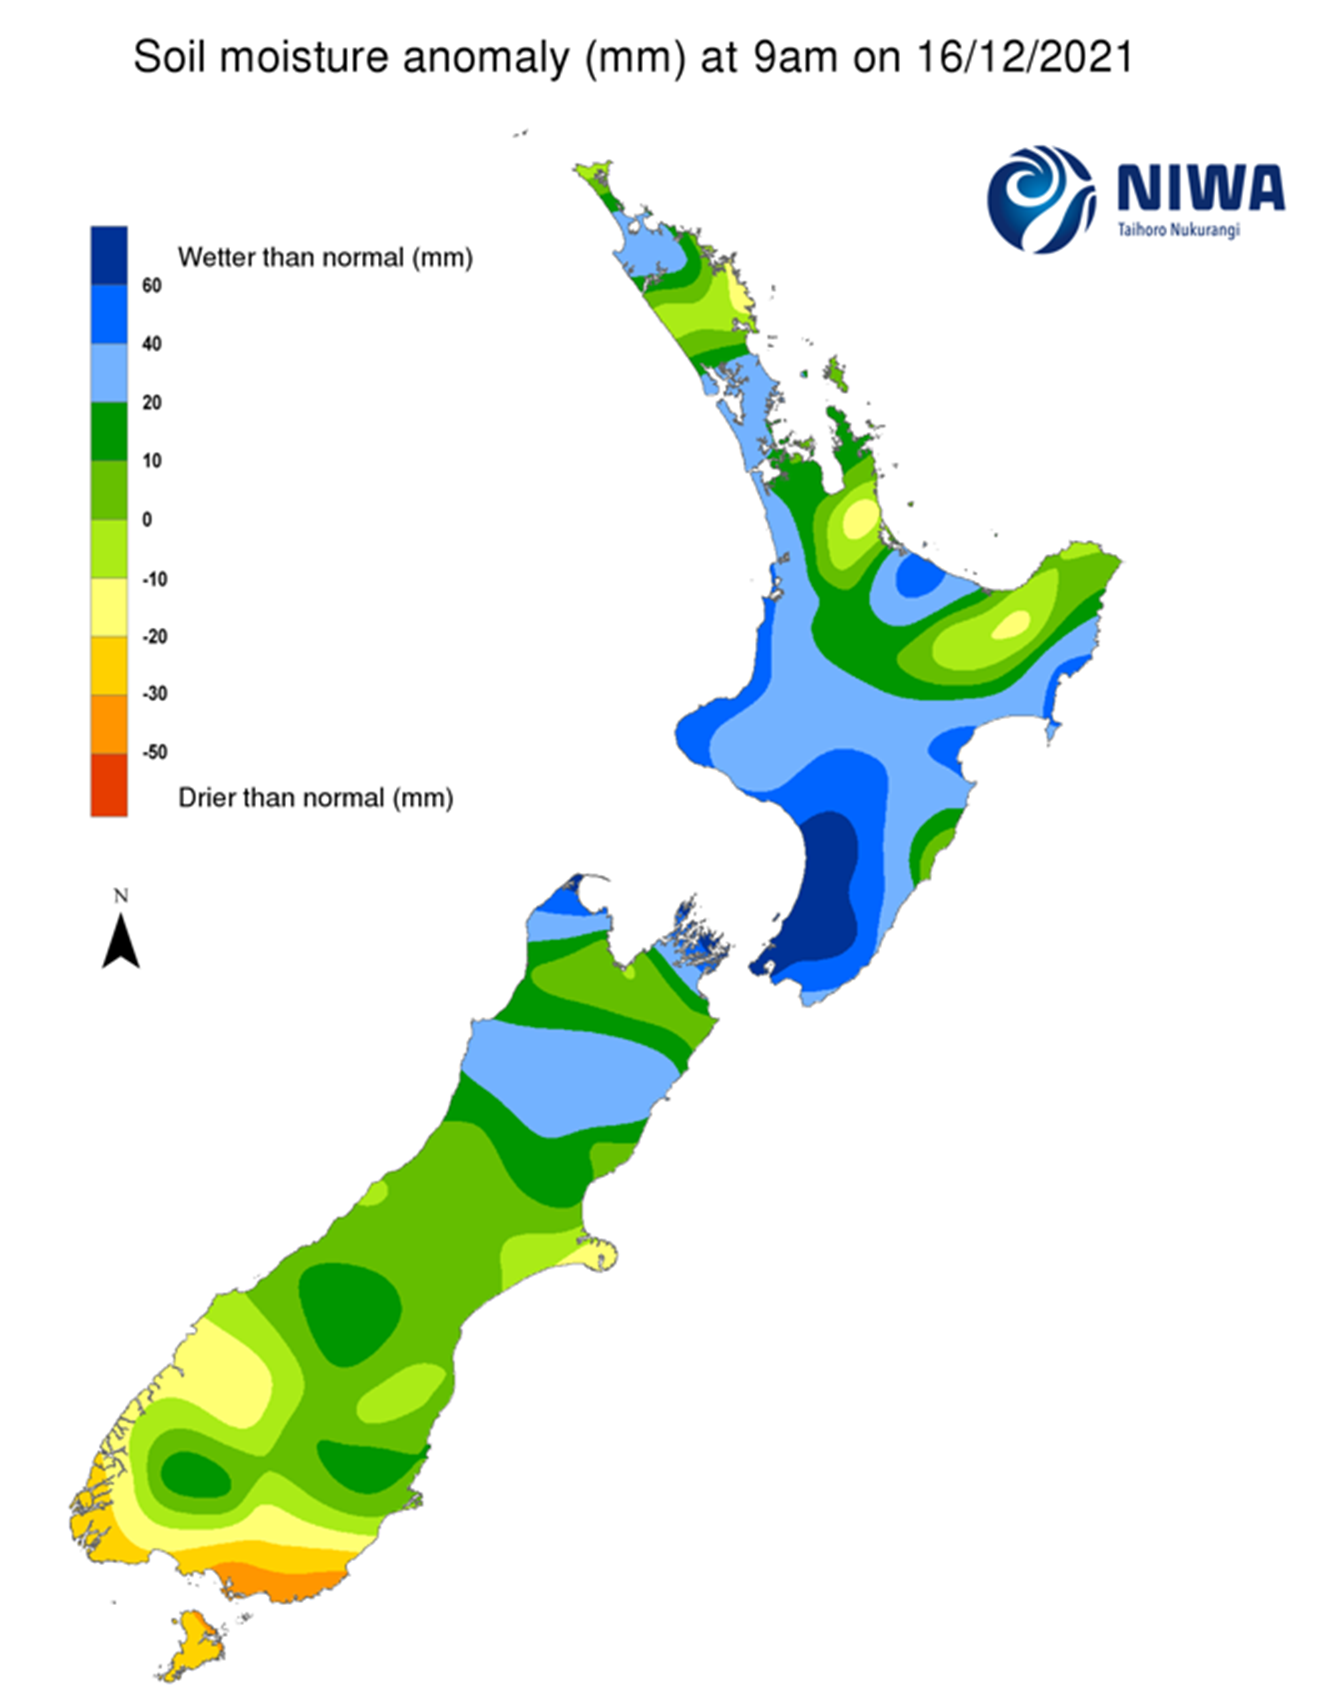
Pictured above: Soil Moisture Anomaly Maps, relative to this time of year. The maps show soil moisture anomaly for the past two weeks.
As of 14 December, the New Zealand Drought Index (NZDI) map below shows that dry conditions are located in Wairarapa along with coastal areas from Marlborough to central Canterbury. In addition, very dry conditions are located in coastal Wairarapa. Please note: some hotspots in the text above may not correspond with the NZDI map. This difference exists because the NZDI uses additional dryness indices, including one which integrates the rainfall deficit over the past 60 days. Changes are therefore slower to appear in the NZDI compared to soil moisture anomaly maps that are instantaneously updated.