A weekly update describing soil moisture patterns across the country to show where dry to extremely dry conditions are occurring or imminent. Regions experiencing significant soil moisture deficits are deemed “hotspots”. Persistent hotspot regions have the potential to develop into drought.
Facts: soil moisture
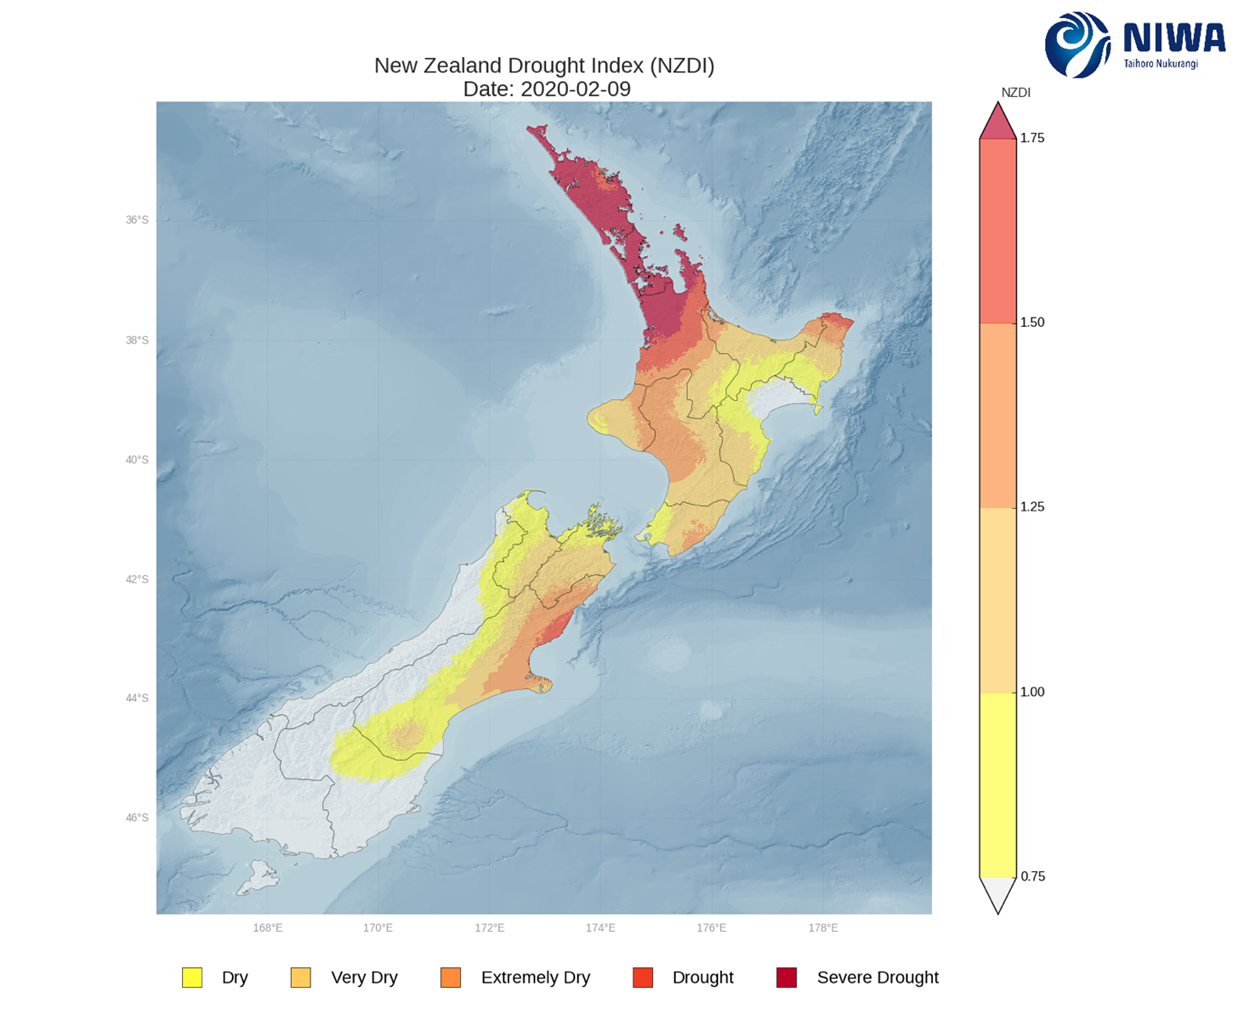
Across the North Island, the past week once again featured little if any rainfall for most locations (generally less than 5 mm). The only exceptions were coastal Wairoa District and a small portion of the Far North where localised amounts of 10-15 mm occurred. The driest soils across the North Island, when compared to normal for this time of the year, are generally found across Northland, western Waikato to Taranaki, the Coromandel Peninsula, and eastern Bay of Plenty, while the wettest soils for this time of the year are located in small portions of the east coast from Wairoa District to Wairarapa. Meanwhile, the New Zealand Drought Index (NZDI) shows that the upper North Island has widespread severe meteorological drought, with meteorological drought also affecting central Waikato and East Cape (see NZDI map at bottom). Furthermore, on 11 February the Ministry for Primary Industries classified the drought conditions in Northland as an adverse event for the primary sector.
At this time nearly all of the North Island has reached official hotspot status, with only a few isolated areas in the central and lower North Island that have not yet reached hotspot criteria.
After early last week’s heavy rain and flooding in the lower South Island, rainfall during the past seven days has generally been quite light, with amounts in northern and central areas of the South Island generally less than 10 mm. Meanwhile, amounts of 10-25 mm were observed in Southland. Soil moisture levels in the lower South Island have improved markedly, and moderately in central areas, while little change has been observed in the northern South Island. The driest soils in the South Island compared to normal for this time of the year are located across Tasman and northern Buller District, while the wettest soils for this time of the year are found across Otago and Southland.
Current hotspots in the South Island now include Nelson and nearby parts of Tasman and Marlborough, along with coastal Hurunui and parts of Ashburton and Selwyn districts.
Outlook and soil moisture
In the North Island, very dry conditions will continue for at least the next several days as high pressure sits overhead. Beginning early next week (17-19 February), a moist air mass associated with weakening ex-tropical cyclone Uesi is likely to move over the North Island, increasing the chance for scattered moderate to heavy showers and thunderstorms. Due to this setup, rainfall distribution across the North Island is likely to be inconsistent, so while many areas could receive 10-20 mm, isolated locations could see substantially more.
With rainfall across the North Island expected to be quite variable during the next week, locations that see the heaviest showers and thunderstorms could see at least small soil moisture increases. Conversely, locations that miss out on significant rainfall may see further soil moisture decreases. However, no significant changes to current hotspot areas are expected.
In the South Island, a weak front will bring showers to southern areas on Thursday morning (13 February) with amounts around 5 mm possible. Then, after a couple days of mostly dry weather, weakening ex-tropical cyclone Uesi may approach the West Coast and Fiordland from Sunday through Tuesday (16-18 February). At this time Uesi’s exact track remains uncertain, but there is an increasing chance for heavy rain in the western South Island, where amounts may exceed 100 mm. Elsewhere in the lower South Island, amounts of 50 mm or more will be possible, while eastern areas may receive little rainfall due to blocking from the Southern Alps.
Due to the likelihood of heavy rain from Uesi, soil moisture levels will likely increase during the next week across the western and lower South Island. Conversely, at least minor decreases are likely in eastern areas, particularly central and northern Canterbury. Hotspot areas in the top of the South Island may improve during the next week, while those currently located in Canterbury are likely to strengthen and expand.
Background
Hotspot Watch: a weekly advisory service for New Zealand media. It provides soil moisture and precipitation measurements around the country to help assess whether extremely dry conditions are imminent.
Soil moisture deficit: the amount of water needed to bring the soil moisture content back to field capacity, which is the maximum amount of water the soil can hold.
Soil moisture anomaly: the difference between the historical normal soil moisture deficit (or surplus) for a given time of year and actual soil moisture deficits.
Definitions: “Extremely” and “severely” dry soils are based on a combination of the current soil moisture status and the difference from normal soil moisture (see soil moisture maps)
Hotspot: A hotspot is declared if soils are "severely drier than normal" which occurs when Soil Moisture Deficit (SMD) is less than -110 mm AND the Soil Moisture Anomaly is less than -20 mm.
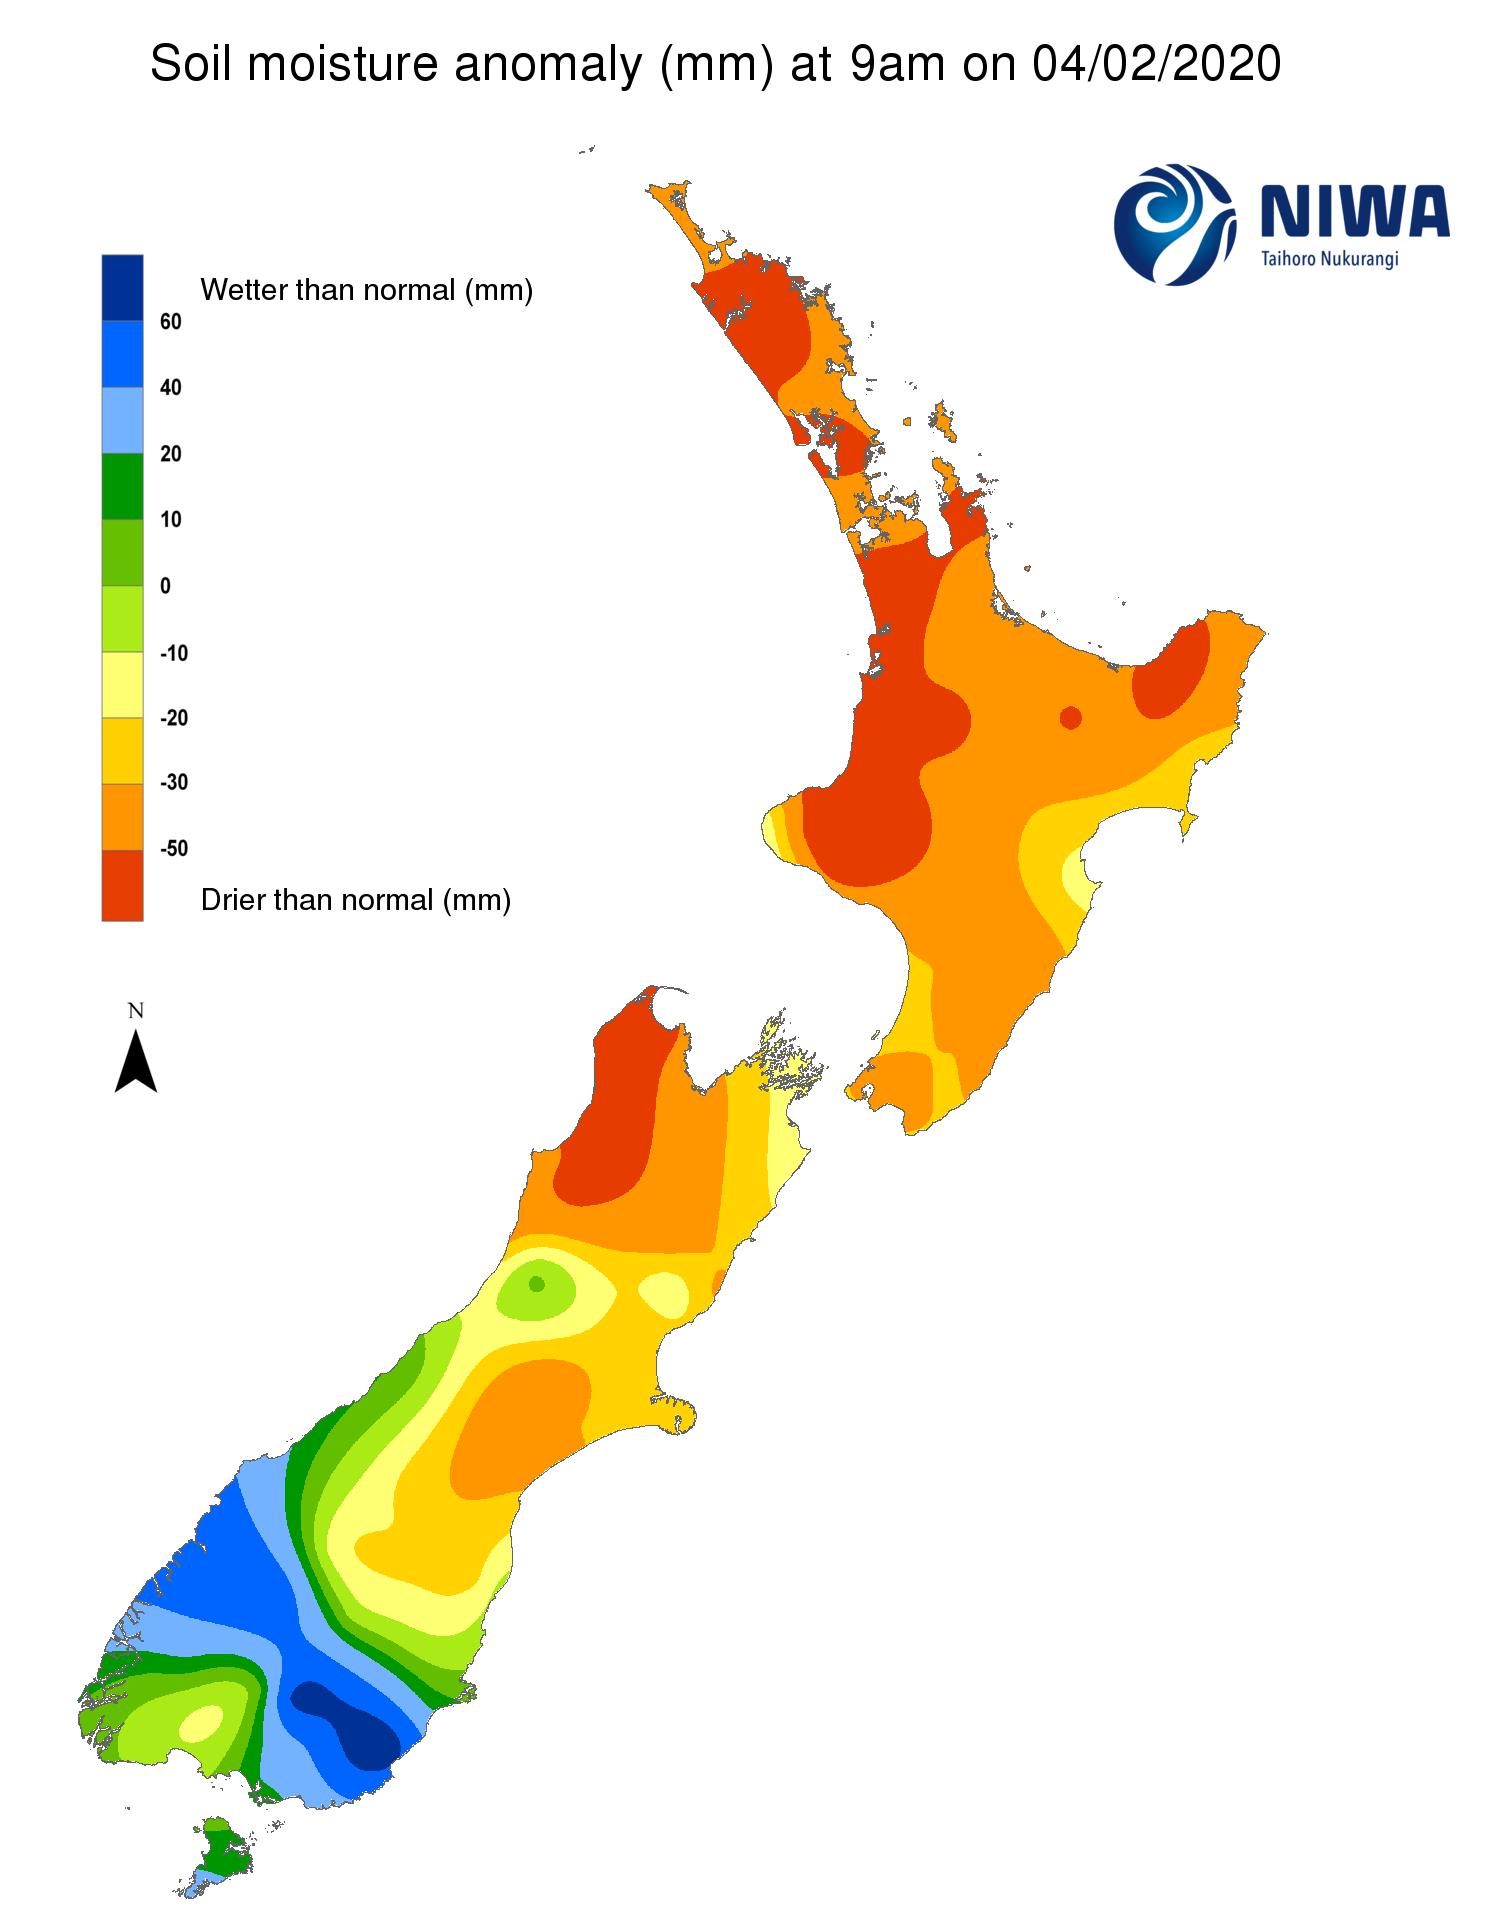
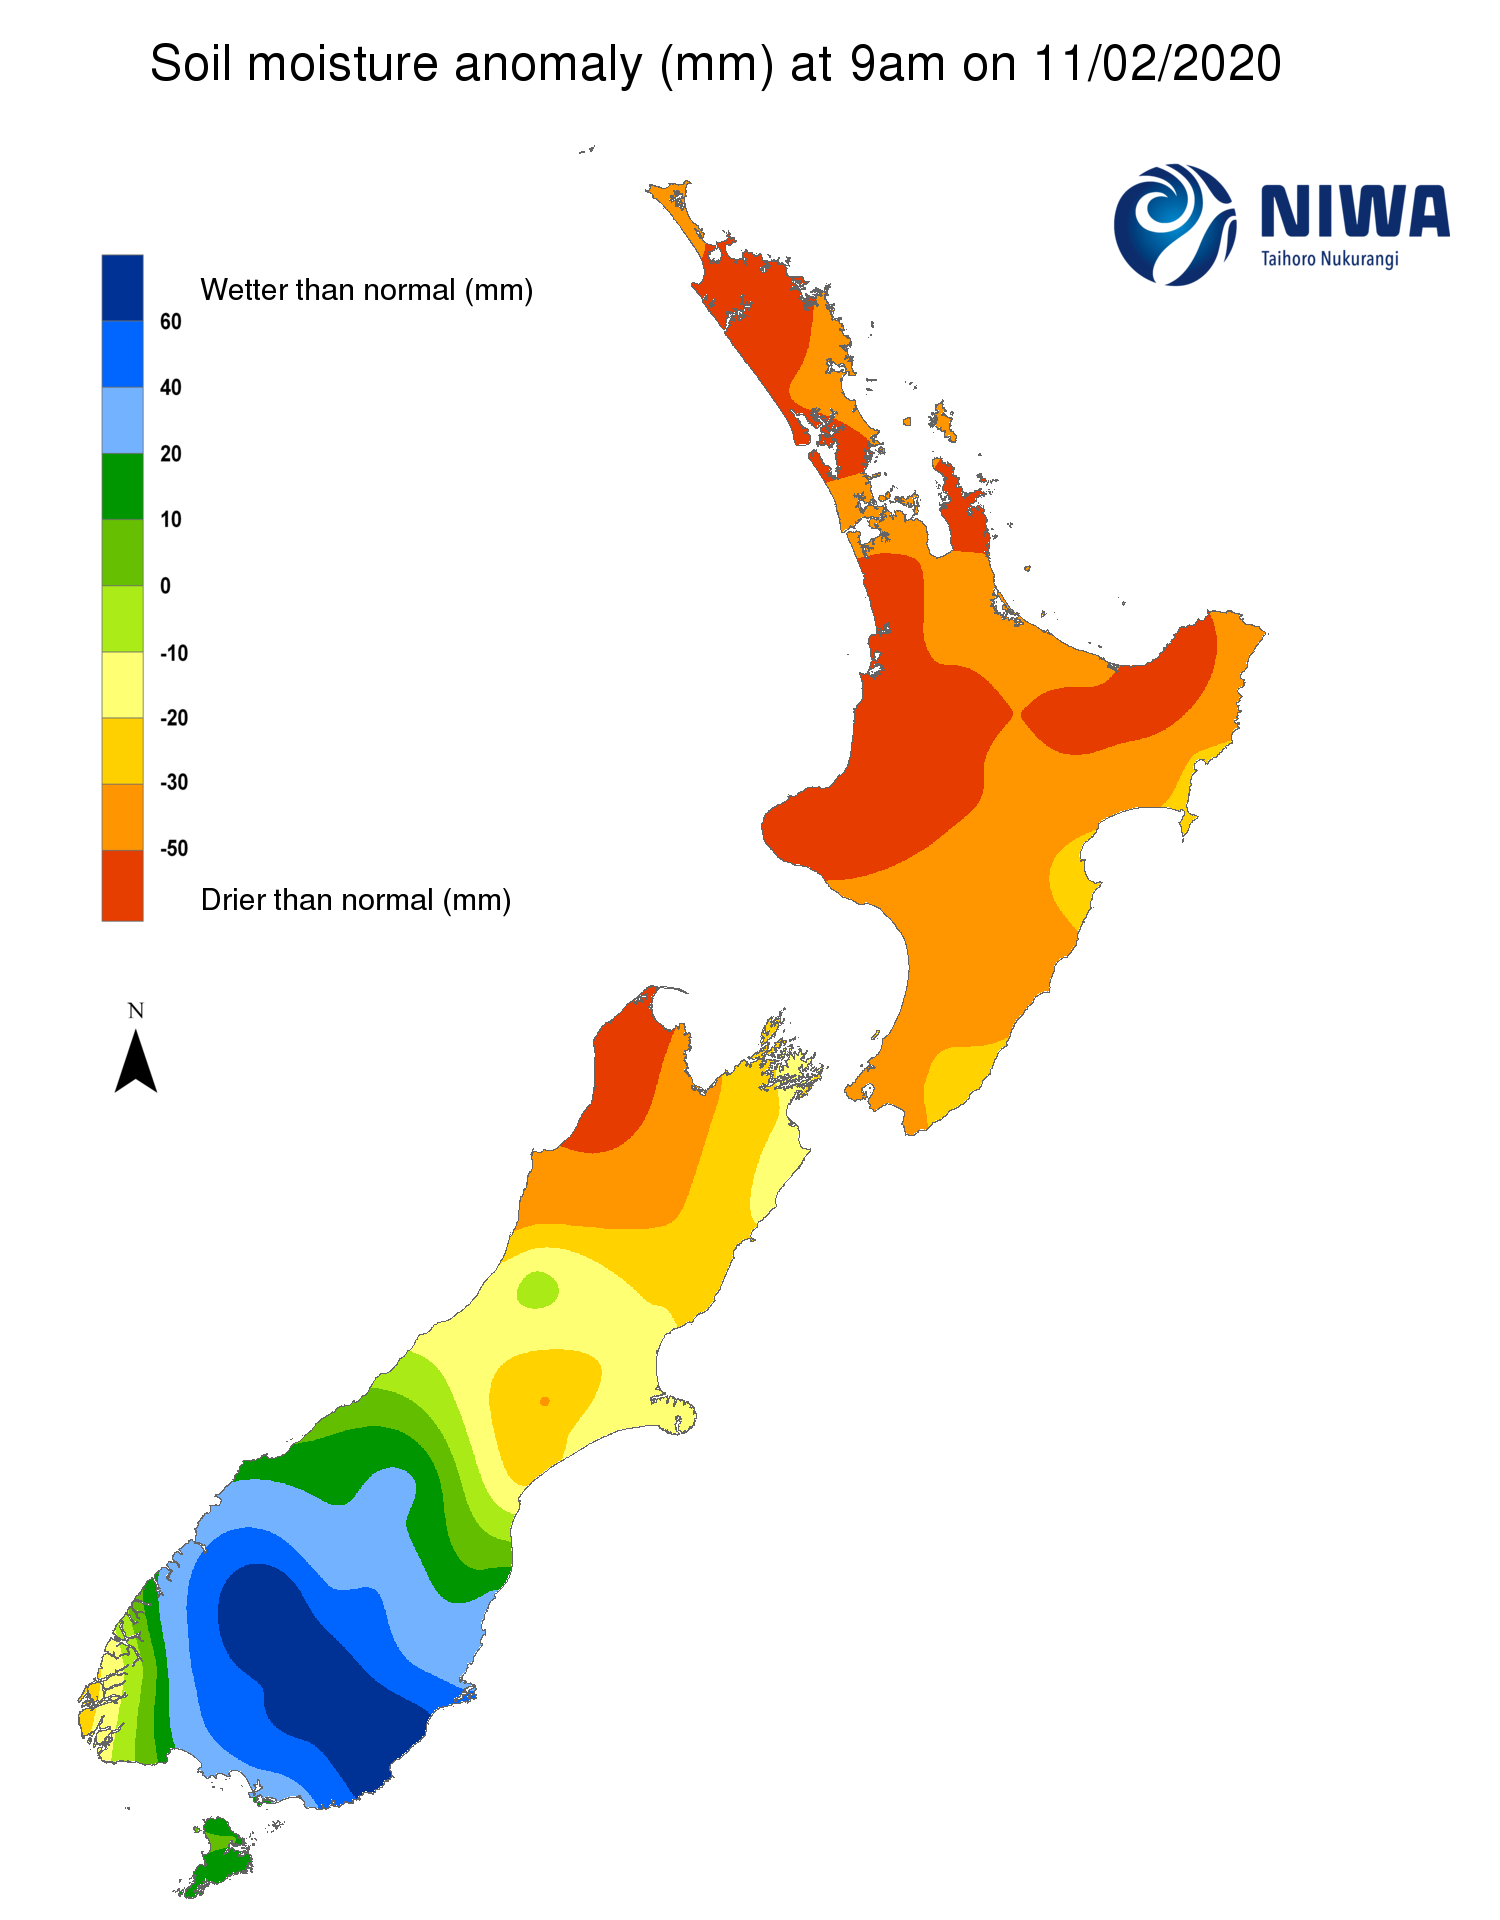
Soil Moisture Anomaly Maps, relative to this time of year. The maps show soil moisture anomaly for the past two weeks.
As of 9 February, the New Zealand Drought Index (NZDI) map below shows that the upper North Island has widespread severe meteorological drought, while central Waikato and East Cape have also entered meteorological drought. In the South Island, extremely dry soils and even meteorological drought have spread across much of northern and central Canterbury. Please note: some hotspots in the text above may not correspond with the NZDI map. This difference exists because the NZDI uses additional dryness indices, including one which integrates the rainfall deficit over the past 60 days. Changes are therefore slower to appear in the NZDI compared to soil moisture anomaly maps that are instantaneously updated.