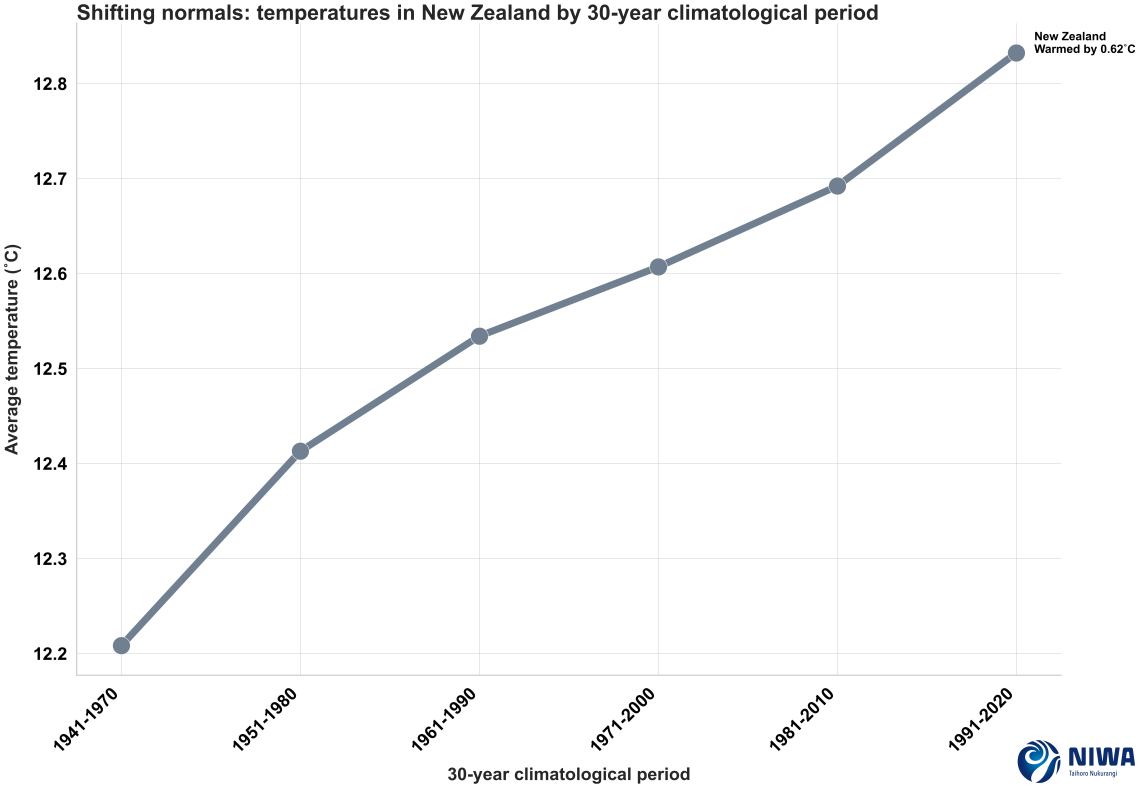
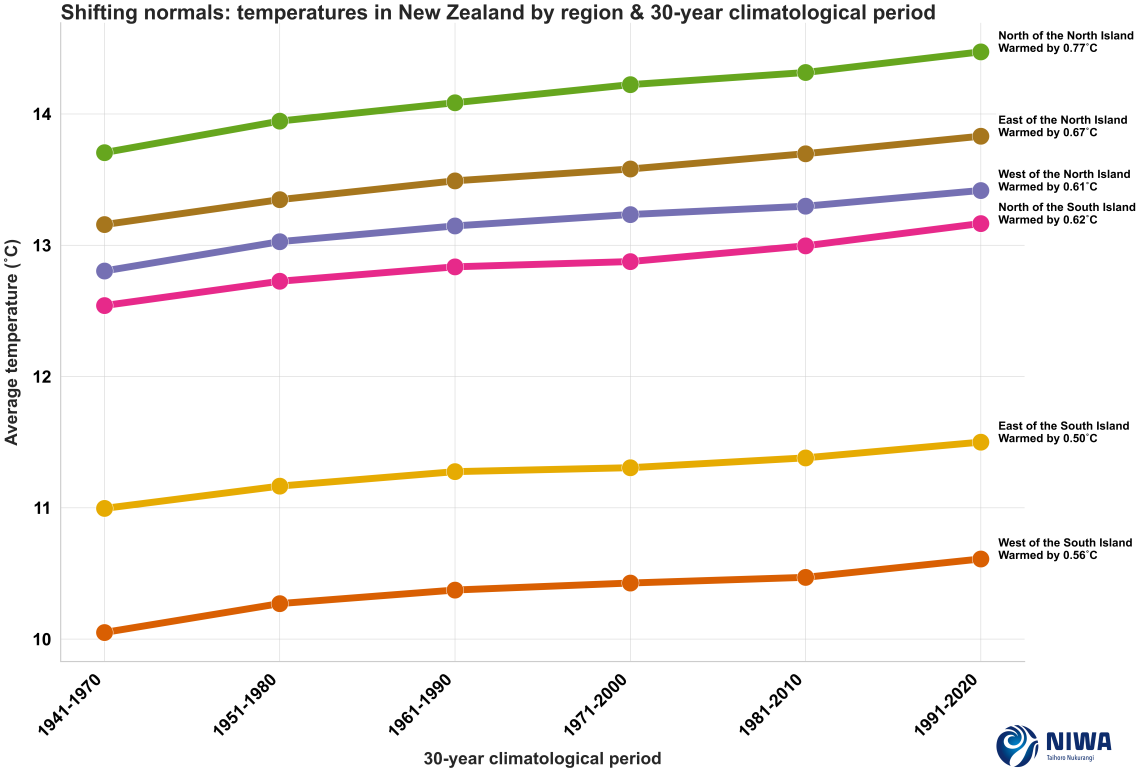
NIWA has completed a major project to analyse how New Zealand’s “climate normals” are shifting.
Climate normals are 30-year averages for variables such as temperature and rainfall.
They are a baseline to describe the current and expected climate in a given location, such as if today’s temperature in Wellington is above or below average for that time of year.
NIWA scientists have completed a study on how the normals in New Zealand are changing and whether the methods used to calculate them can be improved.
Climate Database Scientist Raghav Srinivasan says that climate change is making researchers around the world reconsider how we approach climate normals.
Climate change means we are living with rapid shifts in global and regional climate patterns, so we need to better incorporate these variations when we calculate climate normals. Physical processes such as El Niño and La Niña can have significant influence on the year-to-year variance in seasonal rainfall and temperature too, particularly in New Zealand, meaning they must also be integrated into our calculations,” said Mr Srinivasan.
To help mitigate this, countries including the USA have started using additional alternative normals, such as updating them on a rolling annual basis, to more quickly capture the dynamic changes that our climate is exhibiting.
Currently, the World Meteorological Organization requires countries to update their climate normals only every ten years.
A good case study for New Zealand is that under current 10-year update cycle of the normals, the rainfall totals from Cyclone Gabrielle won't be factored in until the early 2030s when the 2001-2030 normal becomes available. With such extreme events expected to become more common, it would likely be advantageous to add more frequently updated normals to serve as a better reference for future events,” said Mr Srinivasan.
Because normals change after each update, it also means today’s temperature difference becomes less stark compared to more recent periods than later ones.
For example, the daily mean temperature in Auckland on 21st June 2024 was 12.1°C. When this temperature is compared against 1941-1970, it is 0.9°C above normal, whereas when compared against 1991 – 2020, the value is on par with normal.
The study was published in the International Journal of Climatology, by Raghav Srinivasan, Trevor Carey-Smith, Linda Wang, Andrew Harper, Sam Dean, Gregor Macara, Ruotong Wang and Stephen Stuart. The full paper can be viewed here.


