PDF of this article (541 KB)

Nicole Hancock Judi Hewitt
Statistical models can assist in predicting the effects of different levels of sediment in the water for maintaining the health of coastal ecosystems.
You may have noticed that after heavy rain and strong winds the sea along our coasts becomes brown and dirty. Some of this dirt (sediment) is from fine marine sediments being resuspended from the sea floor by wave and current action (see Water & Atmosphere 11(2): 20–21). But rain also washes sediment from the land into the sea, particularly during heavy rain or floods. This occurs especially where the soil is exposed, such as in housing developments, farms and forestry areas (Water & Atmosphere 11(1): 11–13). Streams and rivers carry the terrestrial sediment into estuaries and coastal ecosystems, where it mixes with the sea. Changes in land use over the past 150 years have led to increased sediment runoff into some New Zealand estuaries (Water & Atmosphere 11(1): 14–15).

Why should this matter?
One reason is that shellfish like cockles, pipis and horse mussels all get their food by filtering water through their gills and catching the food particles. During the search for food the shellfish also take in non-food particles suspended in the water (such as sediment). These particles are either bound up in mucus and rejected, or ingested along with the food. Either way, non-food particles require the shellfish to use more energy during feeding, leaving less energy for maintaining healthy weight, growth or reproduction.
Some shellfish species can be very important ecologically (Water & Atmosphere 10(2): 22–23) and many species are also culturally important. Thus there are good reasons for investigating potential threats to shellfish populations.
Measuring sediment and modelling shellfish

Scientists at NIWA have been studying and modelling the effects of sediment particles in the water on the health of some common species of shellfish (cockles, pipis, horse mussels). The amount of sediment carried in the water is described as total particulate matter (TPM). TPM comprises all suspended particles in the water including sediment (silt and clay) and organic material (such as algae). For the modelling part of the work we use a so-called scope-for-growth (SFG) model (see panel).
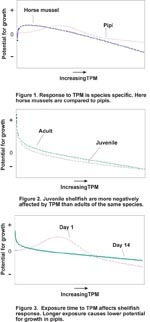
Because species vary in the way they handle and process food, each species needs a separate model. For example in the top graph you can see that the horse mussel shows highest potential for growth at very low levels of TPM. Potential for growth then steadily declines as TPM increases. The pipi’s highest potential for growth occurs at slightly higher TPM levels and then once again potential for growth steadily decreases as TPM increases.
Two factors that the models highlighted as important in shellfish response to TPM were shellfish age and length of exposure to high TPM levels.
Shellfish age
Although both adult and juvenile pipis showed decreasing potential for growth as TPM increased (see centre graph), juvenile pipis were less tolerant of TPM than adult pipis. In the same way that children are more susceptible to some diseases than adults, juvenile shellfish are less resistant to stress than adults.
Length of exposure
The bottom graph shows that pipis exposed to various levels of TPM had a best potential for growth on the first day of exposure at intermediate TPM levels, seen on the graph as a peak on the “Day 1” line. As TPM increased, potential for growth decreased, with lowest potential for growth on day 1 at very high TPM levels. This is because the pipis stopped feeding altogether as they waited for conditions to improve (as they would in the sea when a storm passes). As high TPM conditions continued over the following days, these pipis eventually had to start feeding. The other line on the graph represents predicted potential for growth after 14 days of exposure to a range of TPM levels. By this time, pipi potential for growth was highest at very low TPM and then decreased with increasing TPM, no longer showing the same optimum feeding level behaviour at intermediate TPM levels.
A limitation with all models is that they include assumptions, so the results must be used as guidelines rather than definite outcomes. It is important to remember when using models that they are extrapolations from collected data and they are limited by what information can reasonably be included in the model. Even complex ecophysiological models (see panel) do not deal well with changes to TPM caused by events such as storms. Nor can they accurately take into account site differences in algal composition, or animal health and behaviour.
Conclusions

Our modelling confirmed that shellfish are sensitive to changes in TPM. Thus they can reasonably be used to reflect aspects of the health of ecosystems. Models can help scientists determine effects of TPM on shellfish, by allowing easy visualisation and manipulation of data, and prediction of shellfish response to increased levels of TPM. The information can be used to advise planners and resource managers about the effects of different levels of sediment runoff for monitoring and maintaining the health of coastal ecosystems, taking into account existing marine resuspended sediment levels. Informed managers can then take steps during the planning stages of land development – or estuary restoration – to minimise the effects of sediment runoff on coastal marine ecology.
A choice of models
Models can be used to predict the effects of total particulate matter (TPM) – a measure of sediment suspended in the water – on suspension feeders. We base the models on data collected during experiments. There are several approaches to modelling.
- Statistical models describe trends in the experimental data.
- Scope-for-growth (SFG) models describe shellfish production (potential for growth) in terms of energy in (absorption of food) minus energy out (respiration plus excretion). The SFG model gives us a simple way of visualising the interaction between variables that combine to give the shellfish’s physiological response to TPM.
- More complex ecophysiological models take into account changes in physiological responses to seasonal variations in temperature and food quality, together with population aspects of the shellfish such as size, reproduction and the number of shellfish in one area. NIWA scientists have produced some of these models, which require large amounts of information.
Of these examples, simple SFG models can be quickly assembled and can still give good predictions to responses to TPM.
Nicole Hancock and Judi Hewitt are based at NIWA in Hamilton.
Teachers’ resource for NCEA AS: Biology 1.4, 2.4, 2.5, 2.6, 3.1; Science 1.1, 2.2, 3.1; Geography 3.1. See other curriculum connections at www.niwa.co.nz/pubs/wa/resources
