On 1 July 2025, NIWA merged with GNS Science to become Earth Sciences New Zealand.
Link to source page
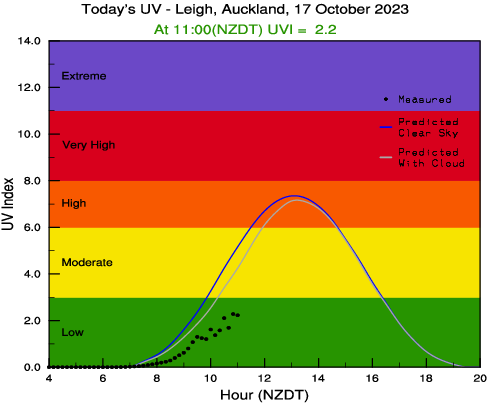
Graph of UV index at every hour with UV Index on y-axis from low (green) to extreme (purple) versus Hour on x-axis from 4 to 20.