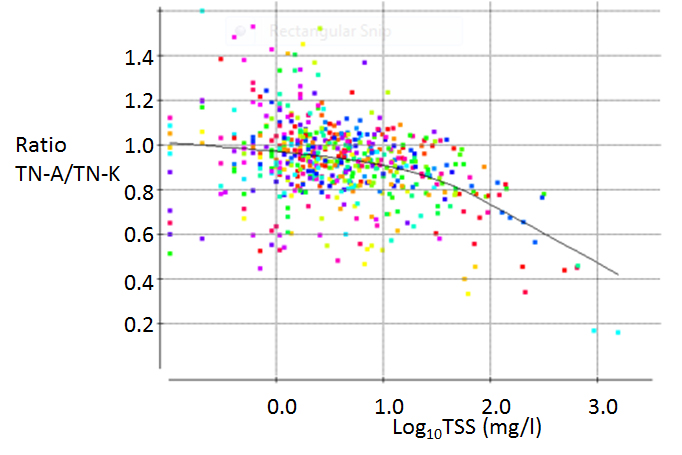
The ratio of TN-A to TN-K plotted against (log-transformed) TSS for 55 river sites in the Wellington Region each sampled monthly for 12 months. Different rivers are plotted with different colours. A LOWESS smoother (convex-up curve) shows the trend of the ratio with total suspended solids (TSS). The ratio of TN-A to TN-K is lowest for the Awhea River at Tora Road (two points on bottom right) at which TN-A was only 16% of TN-K on 27 November and 17% on 30 September, 2013 (with TSS close to 1000 mg/l on both occasions).