NIWA
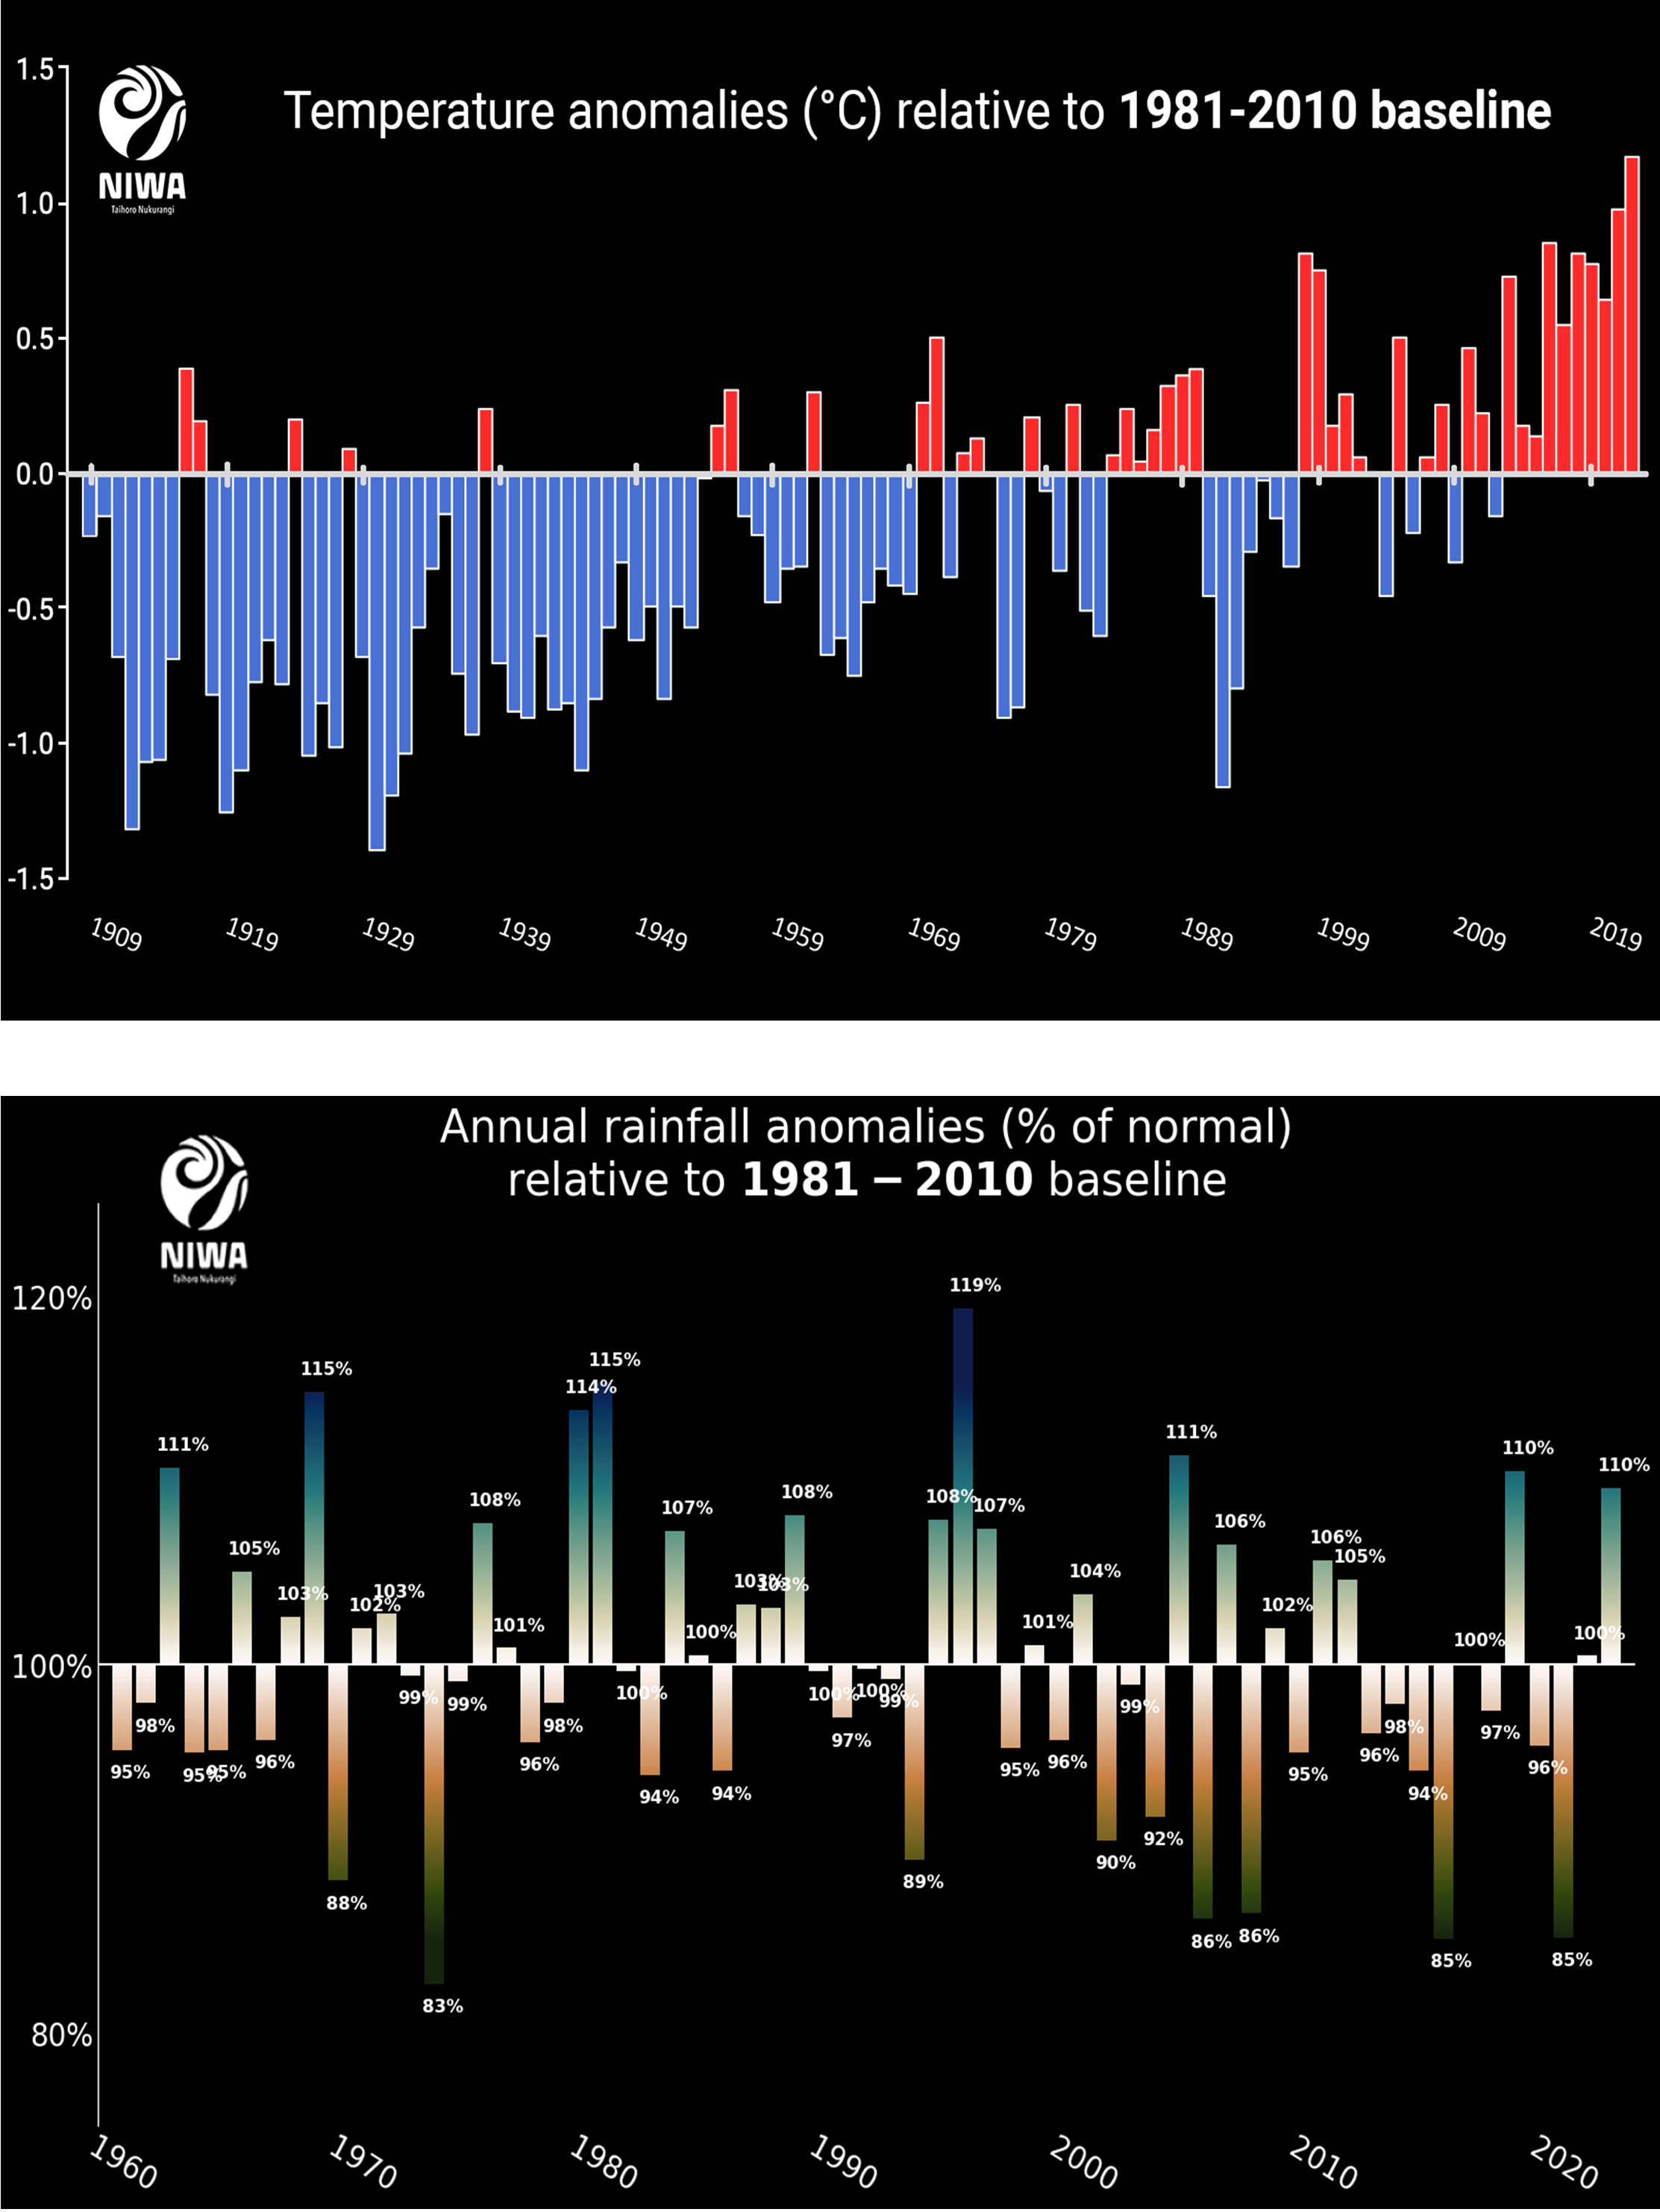
Figure 2: (a) Temperature anomalies from NIWA's seven station series from 1909 to 2022. Blue indicates temperatures colder than the 1981-2010 baseline, red indicates temperatures warmer than the 1981-2010 baseline. (b) Annual rainfall anomalies from 1960-2022 from NIWA’s Virtual Climate Station Network relative to the 1981-2020 baseline, averaged over New Zealand.