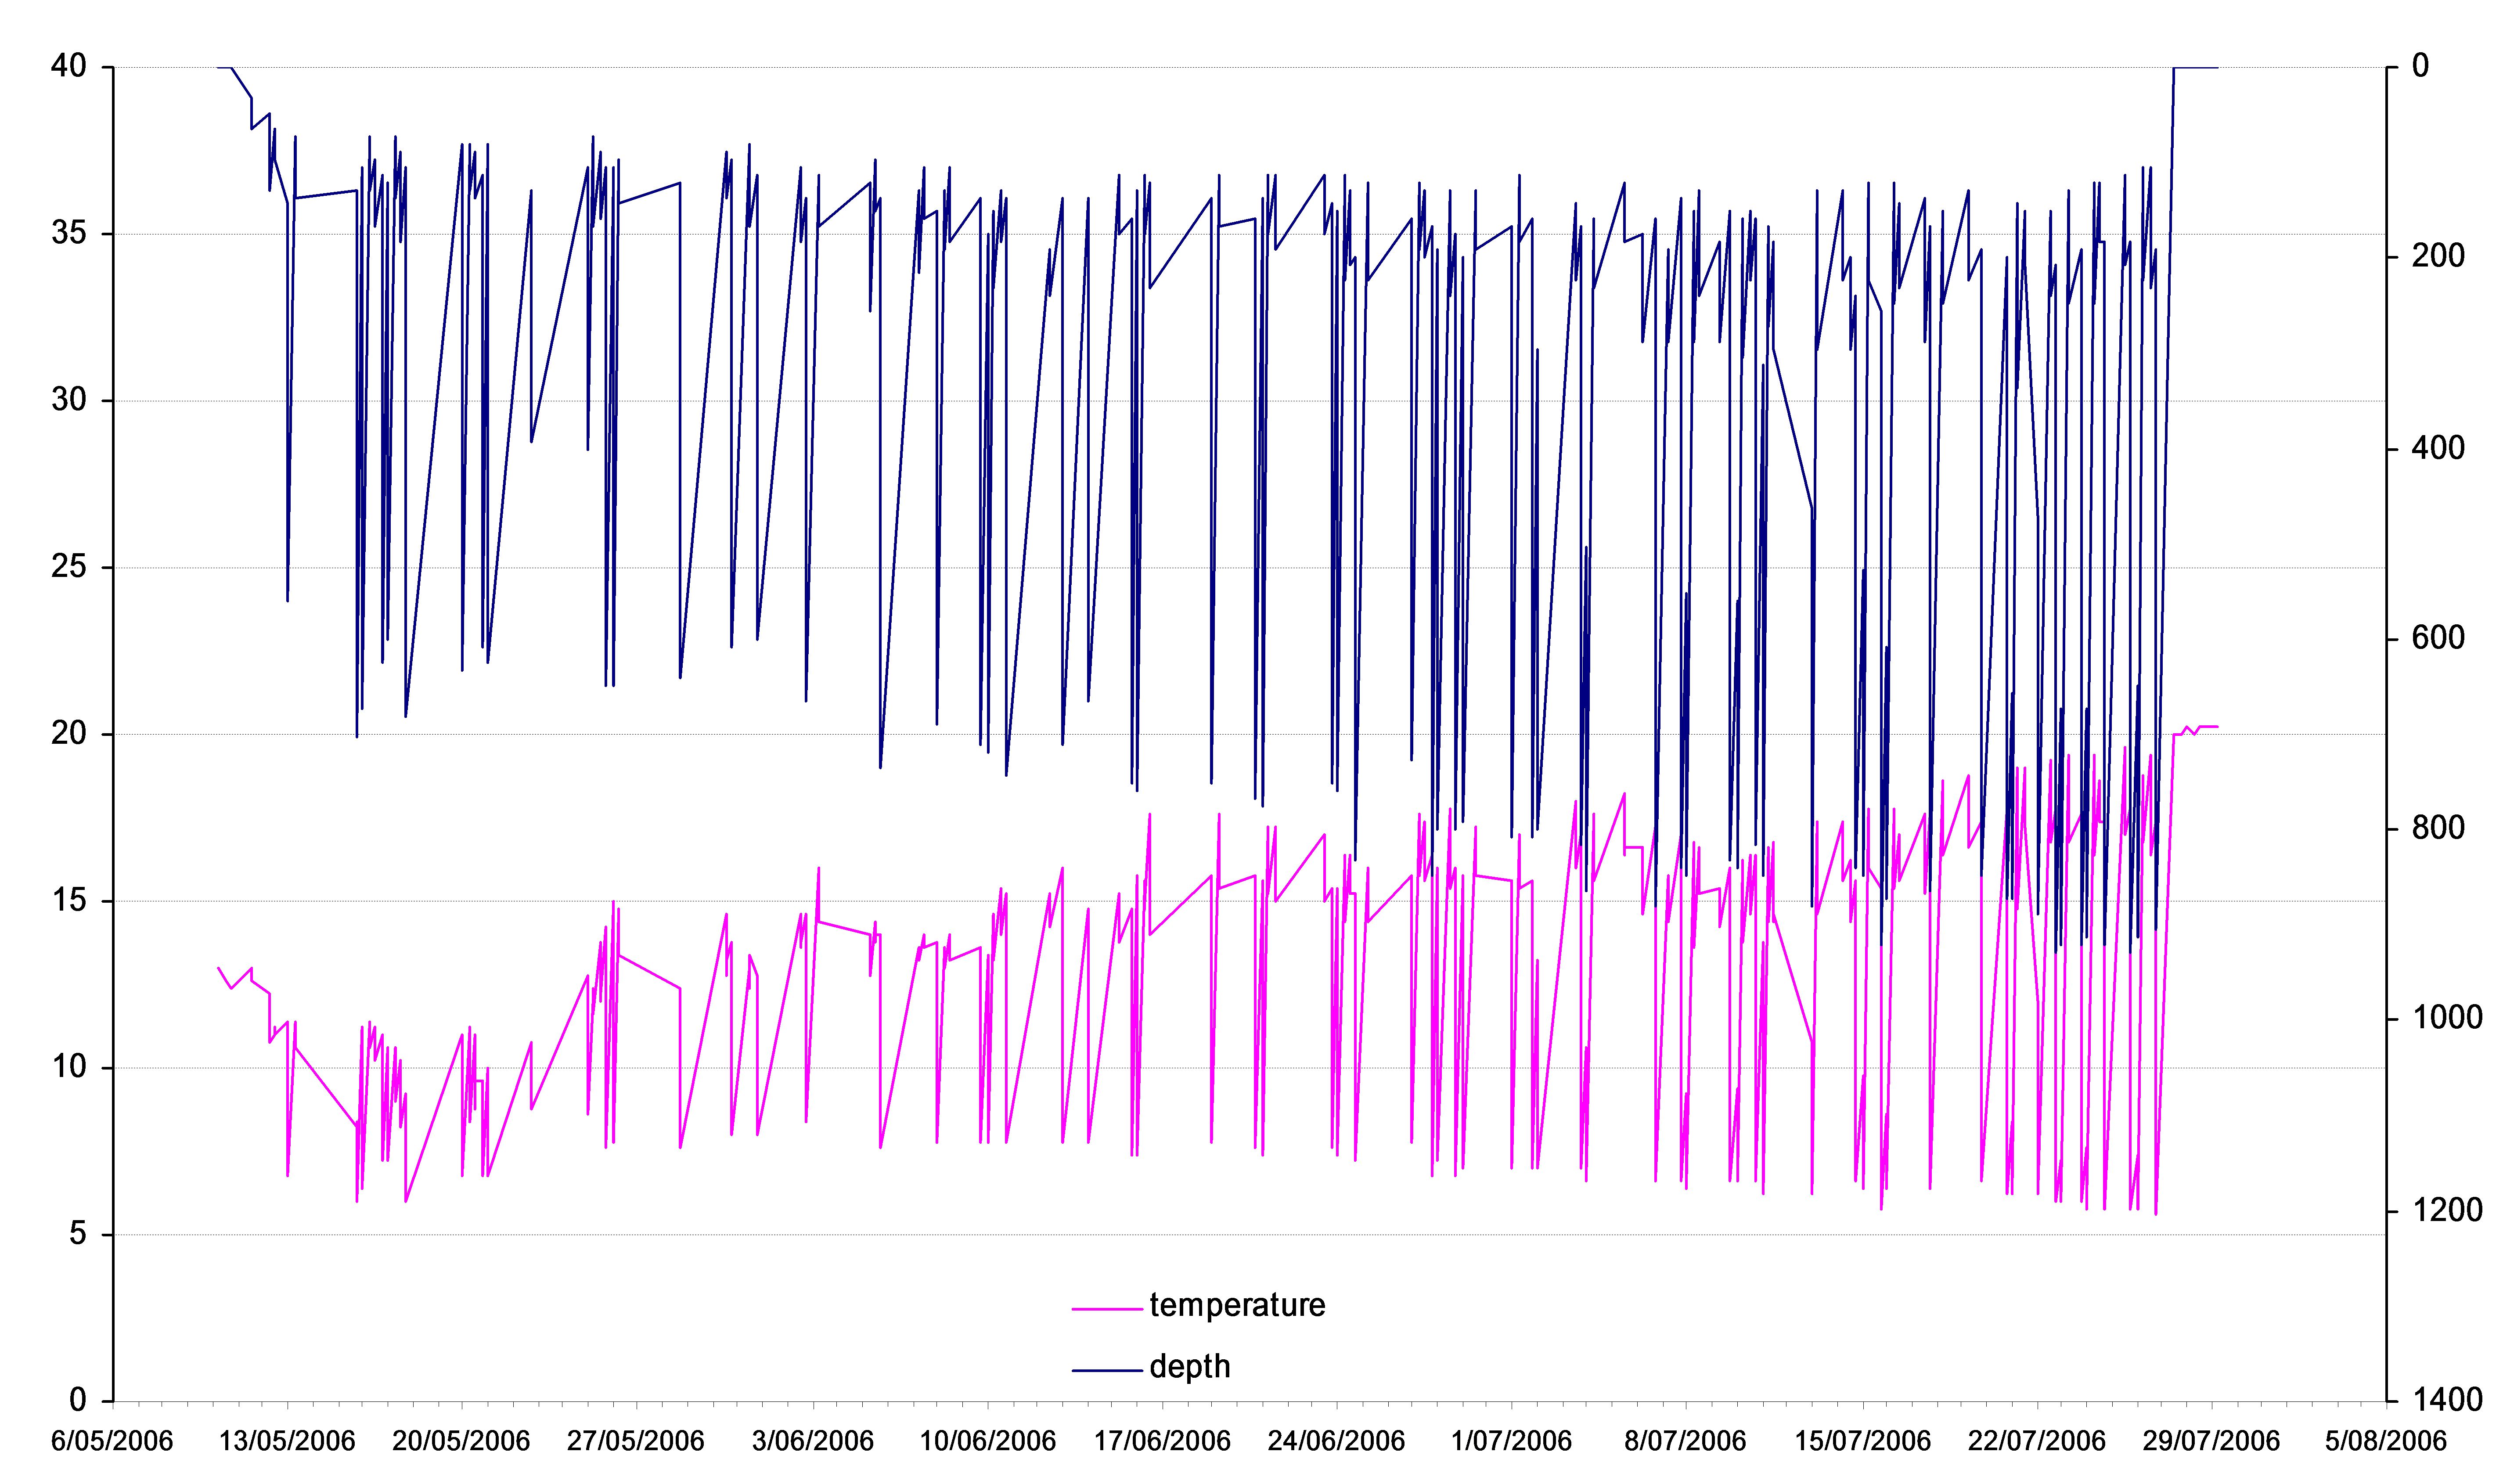
Swimming depth from an archival pop-up tag attached to a migrant eel
This graph shows the swimming depth (in m, right Y axis, blue line) and temperature (in °C, left Y axis, pink line) experienced by one migrant longfin eel during it's ocean journey. Credit: Don Jellyman