NIWA
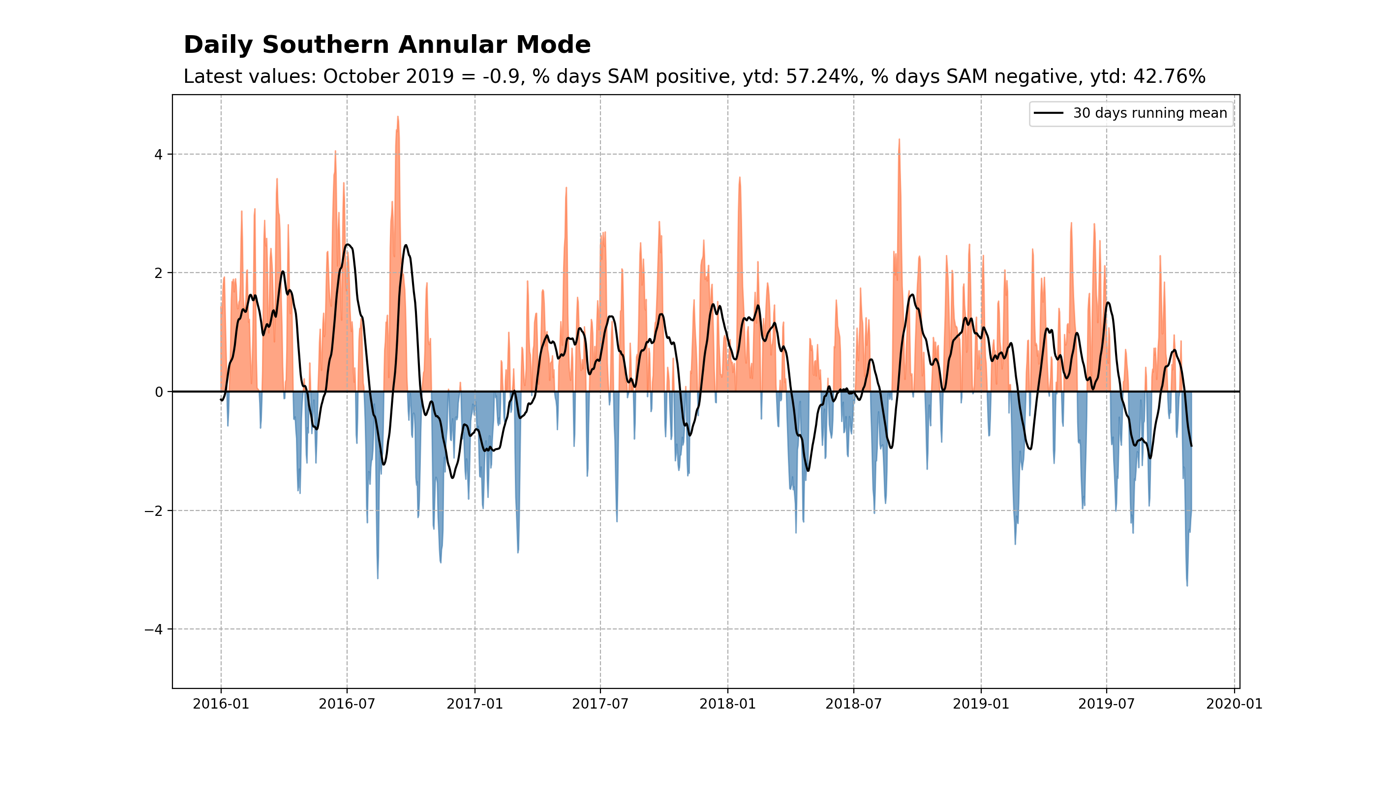
This plot shows the daily values of the SAM over the last 3 years. It also provides the latest monthly value of the SAM and the percentage of time the SAM has spent in its positive and negative phase in the current year. Data: National Centers for Environmental Prediction; updated once monthly