On 1 July 2025, NIWA merged with GNS Science to become Earth Sciences New Zealand.
Link to source page
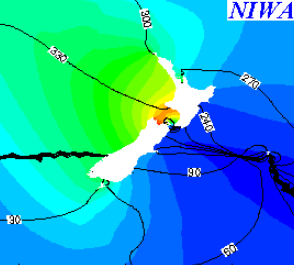
Graphic image of New Zealand Solar Semidiurnal Tide map. Amplitude of tide represented in colour gradient red (high) to blue (low)and the black lines represent the phase.