NIWA
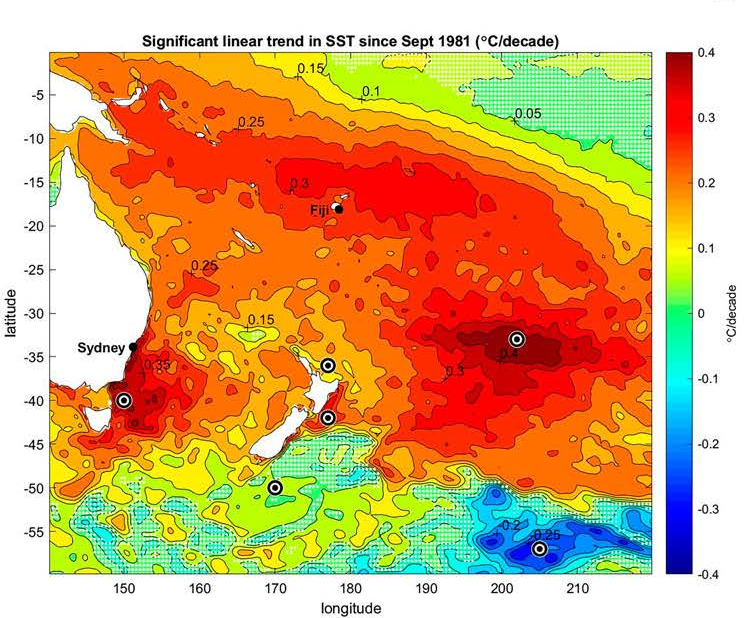
The linear trend in SST 1981–2017 calculated from the NOAA OI SST V2 High Resolution Dataset (Reynolds et al. 2007; Banzon et al. 2016). Regions where the trends are not statistically significant are shaded in white. Contour intervals are 0.05°C/decade. Locations where anomalies are shown later are highlighted.