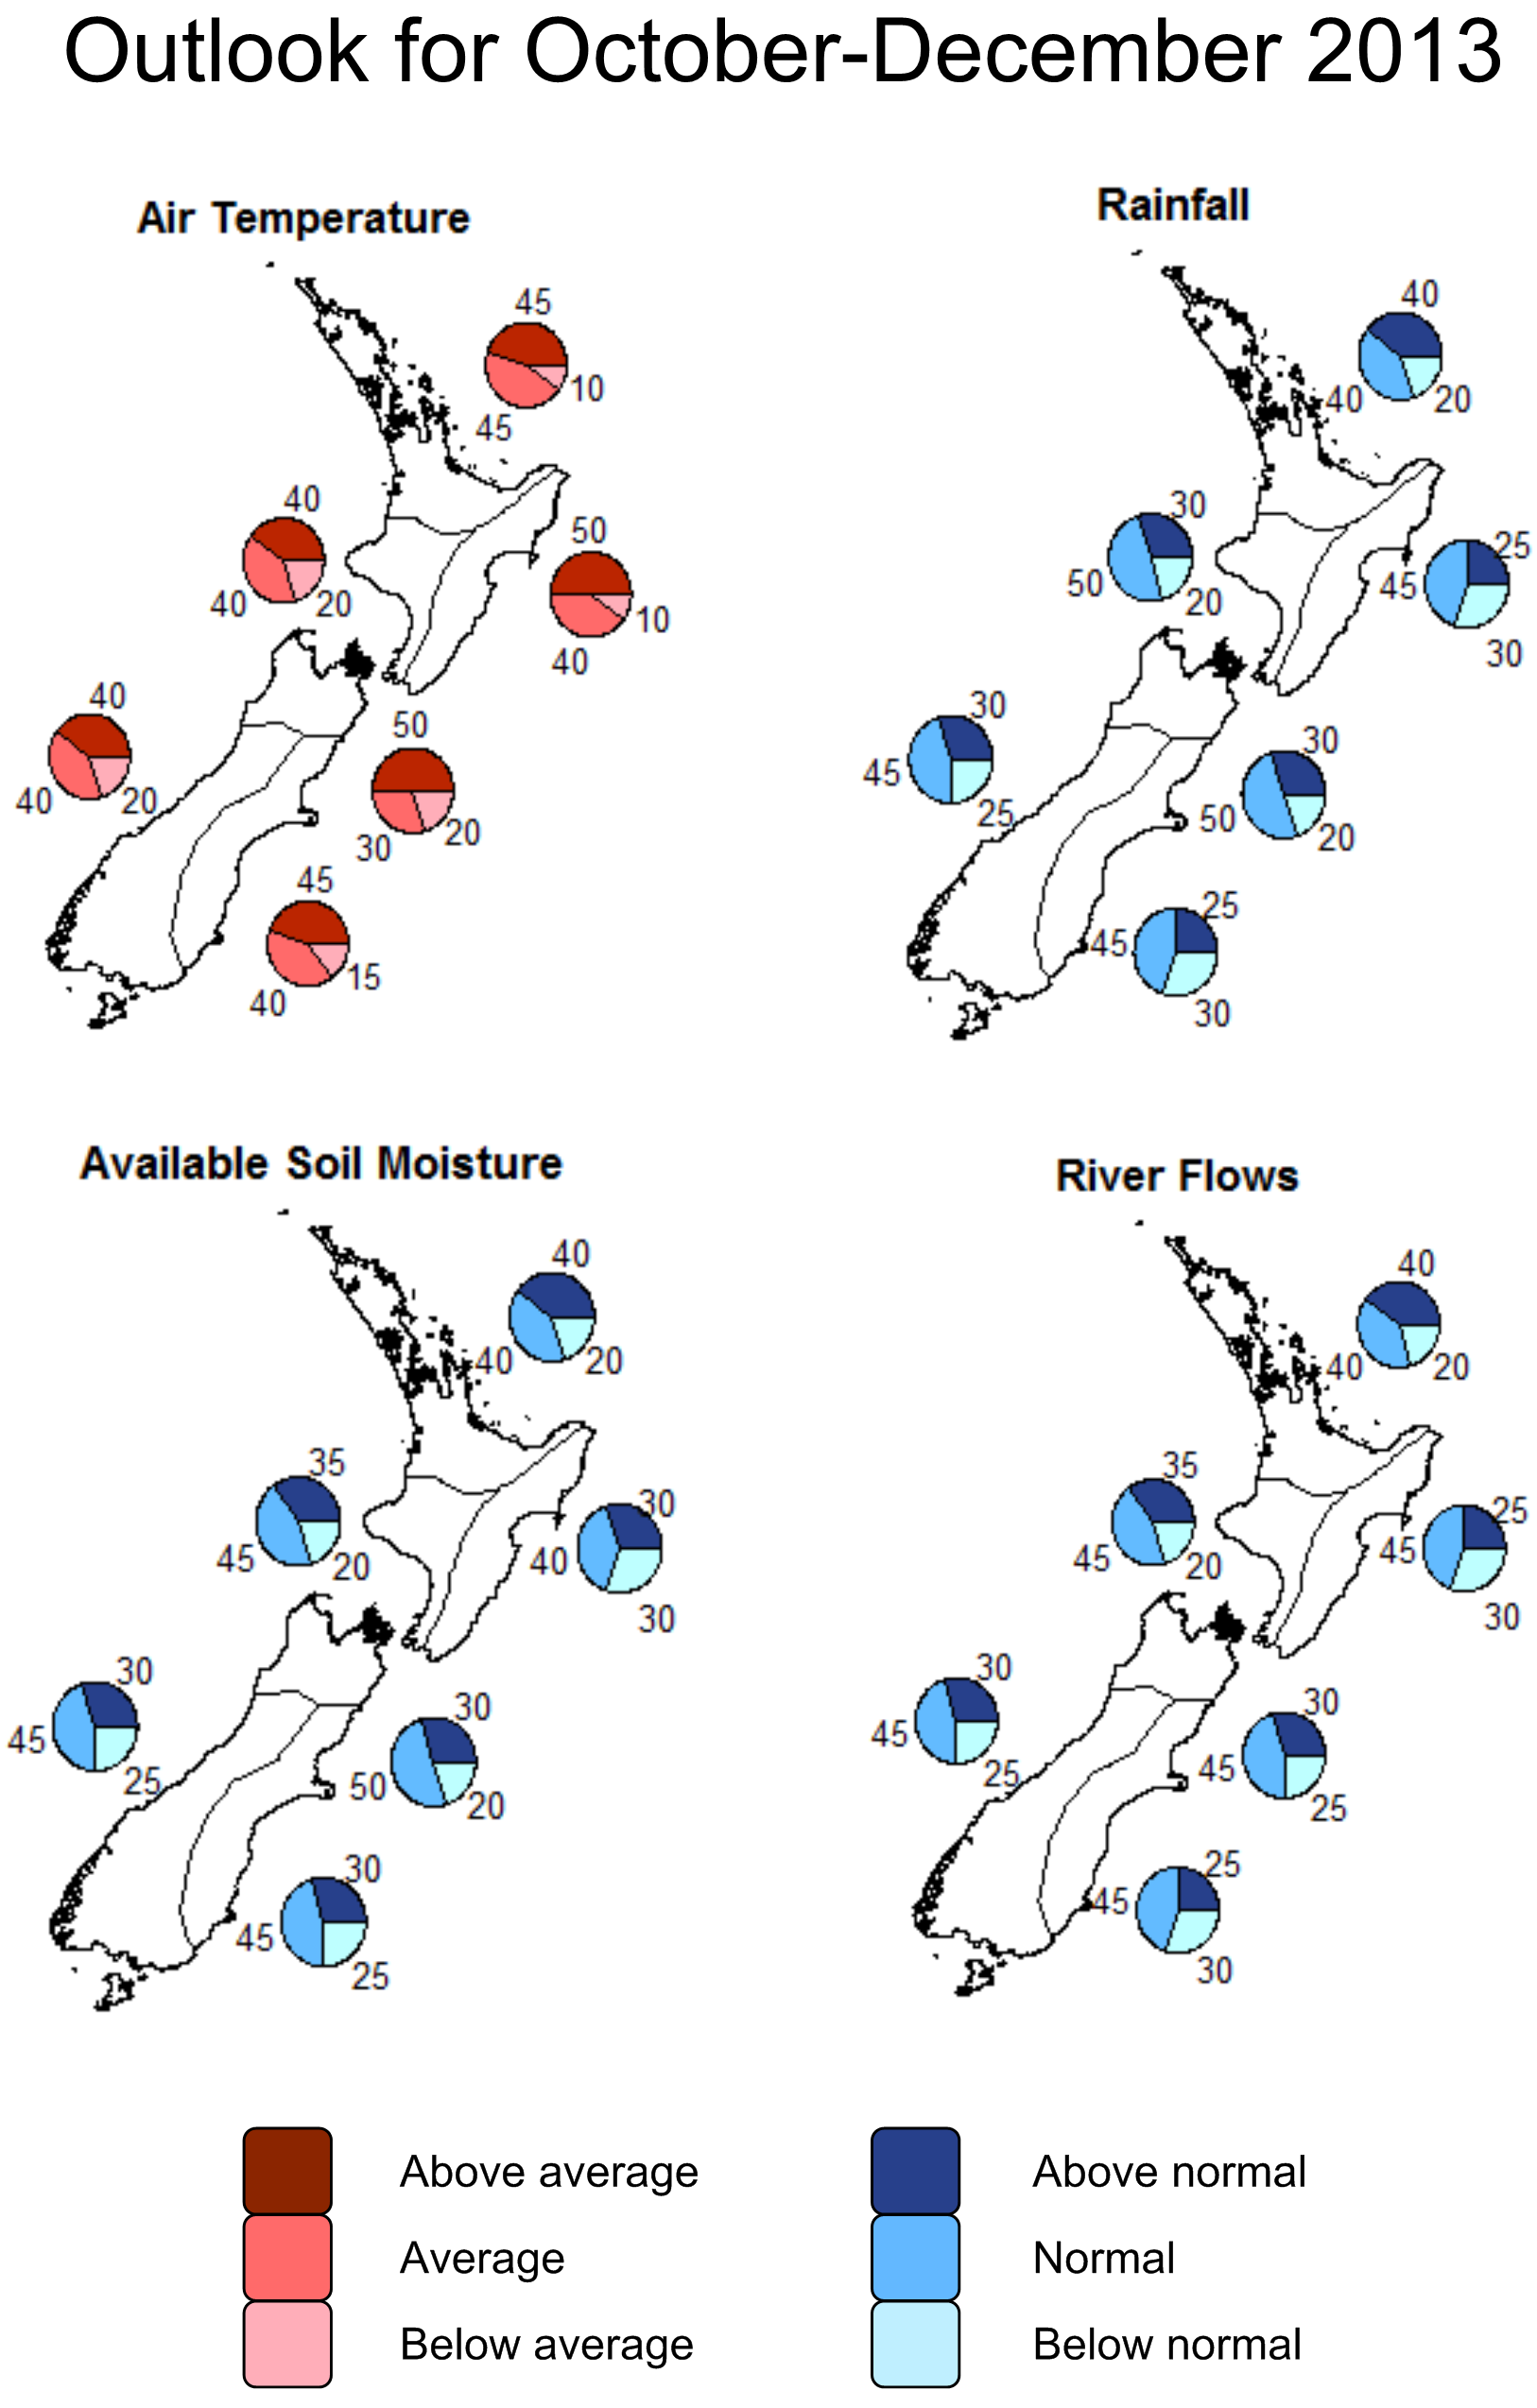
Graphical representation of the regional probabilities, Seasonal Climate Outlook, Oct-Dec 2013. Note: A new colour scheme is being trialled this month – aimed at making the regional probabilities more legible to those with certain forms of colour blindness.