On 1 July 2025, NIWA merged with GNS Science to become Earth Sciences New Zealand.
Link to source page
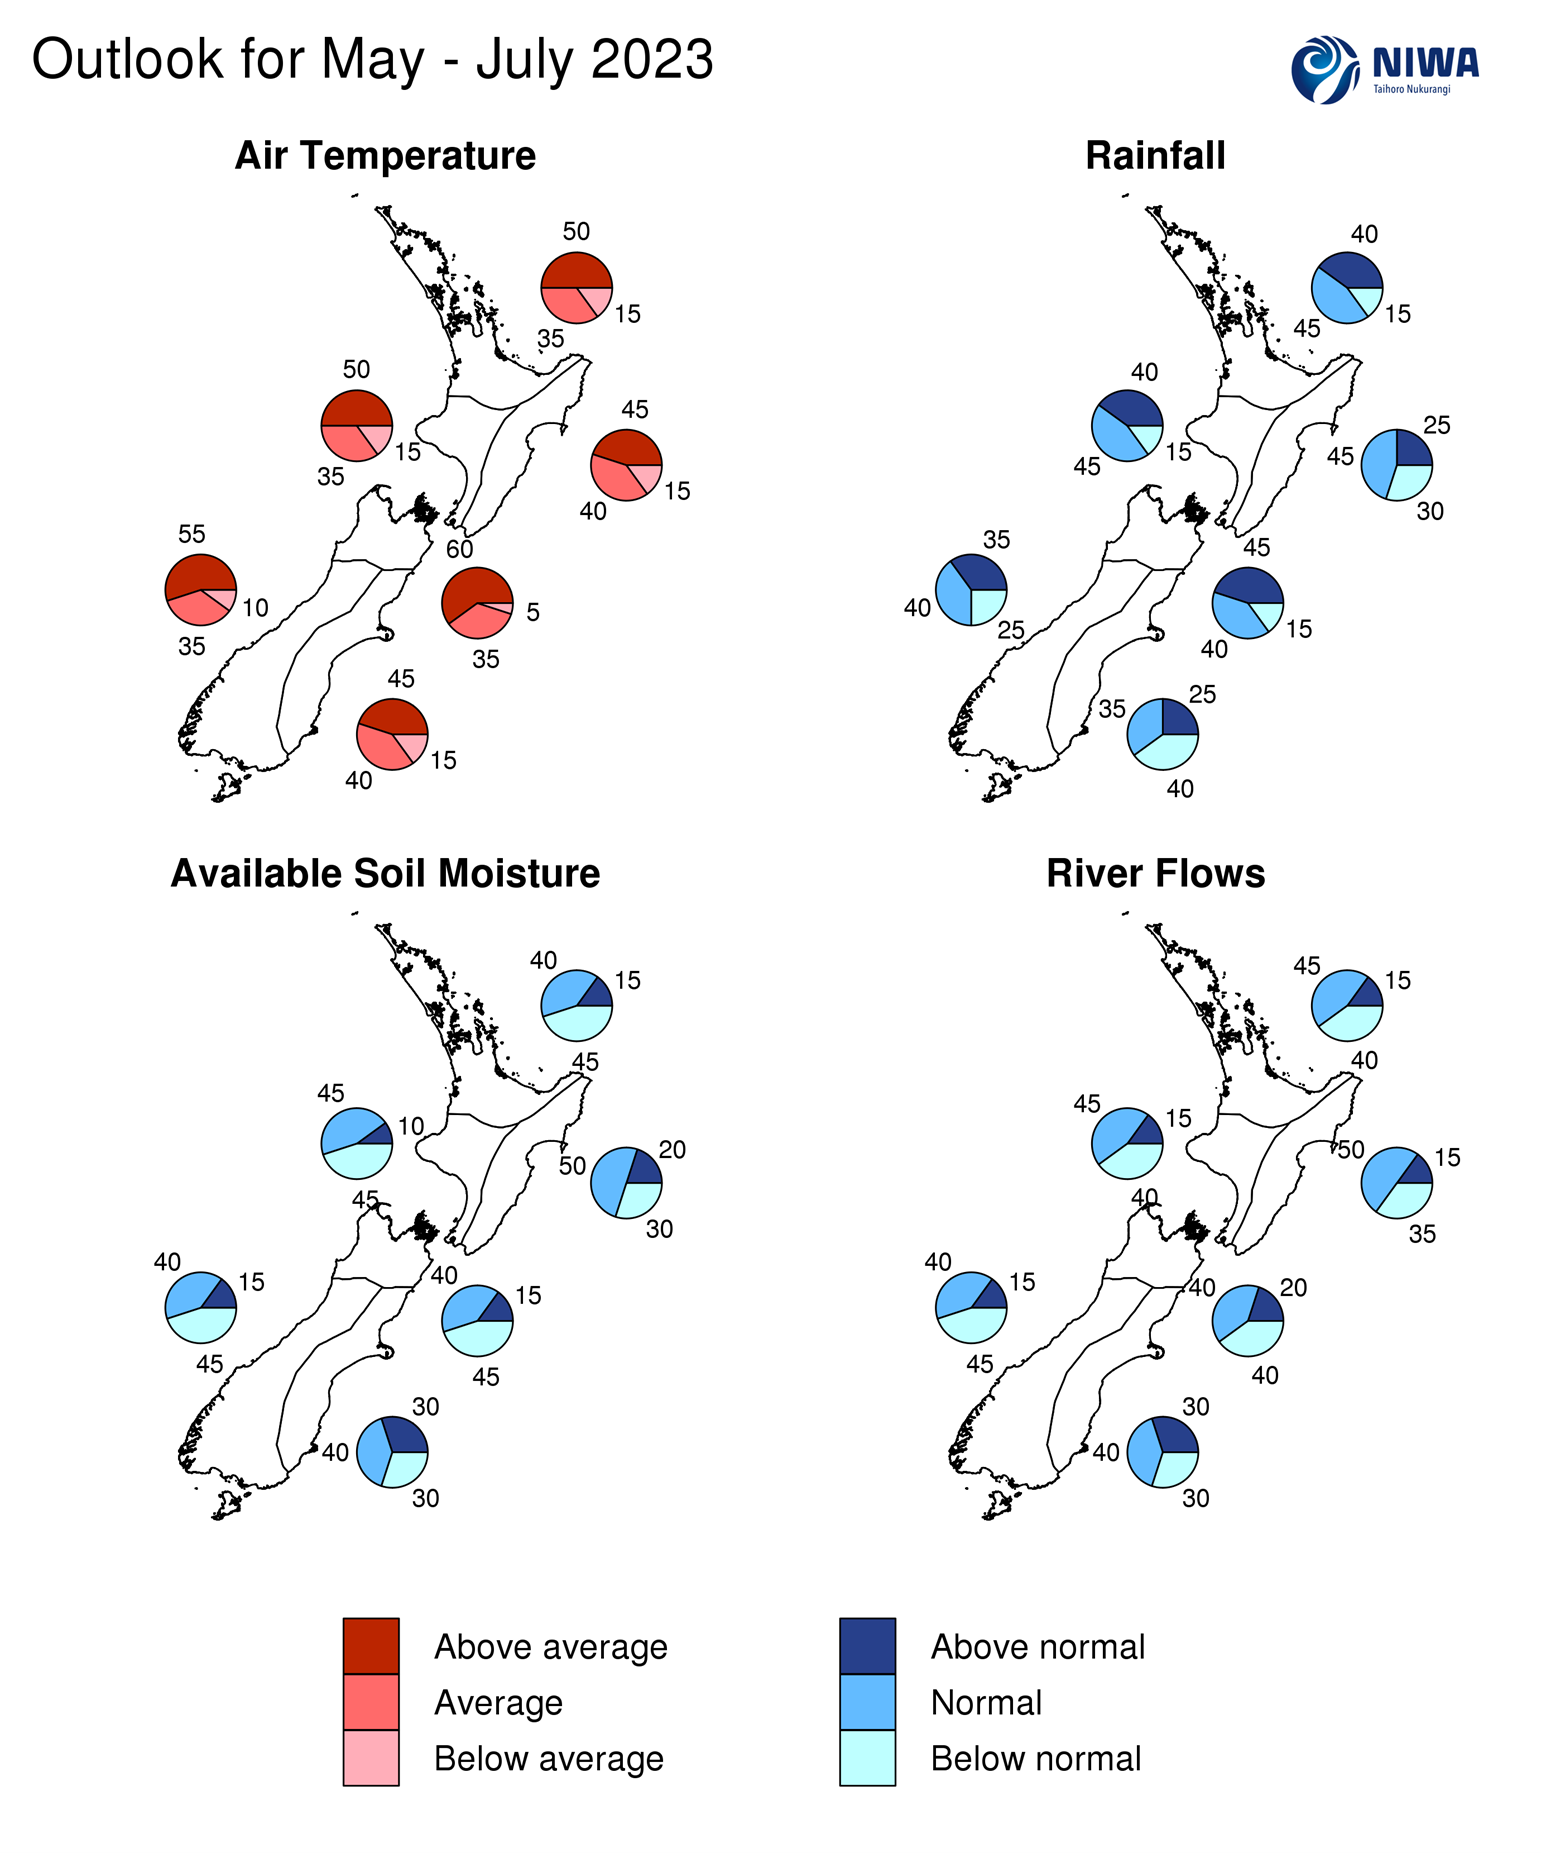
Graphical representation of the regional probabilities.