On 1 July 2025, NIWA merged with GNS Science to become Earth Sciences New Zealand.
Link to source page
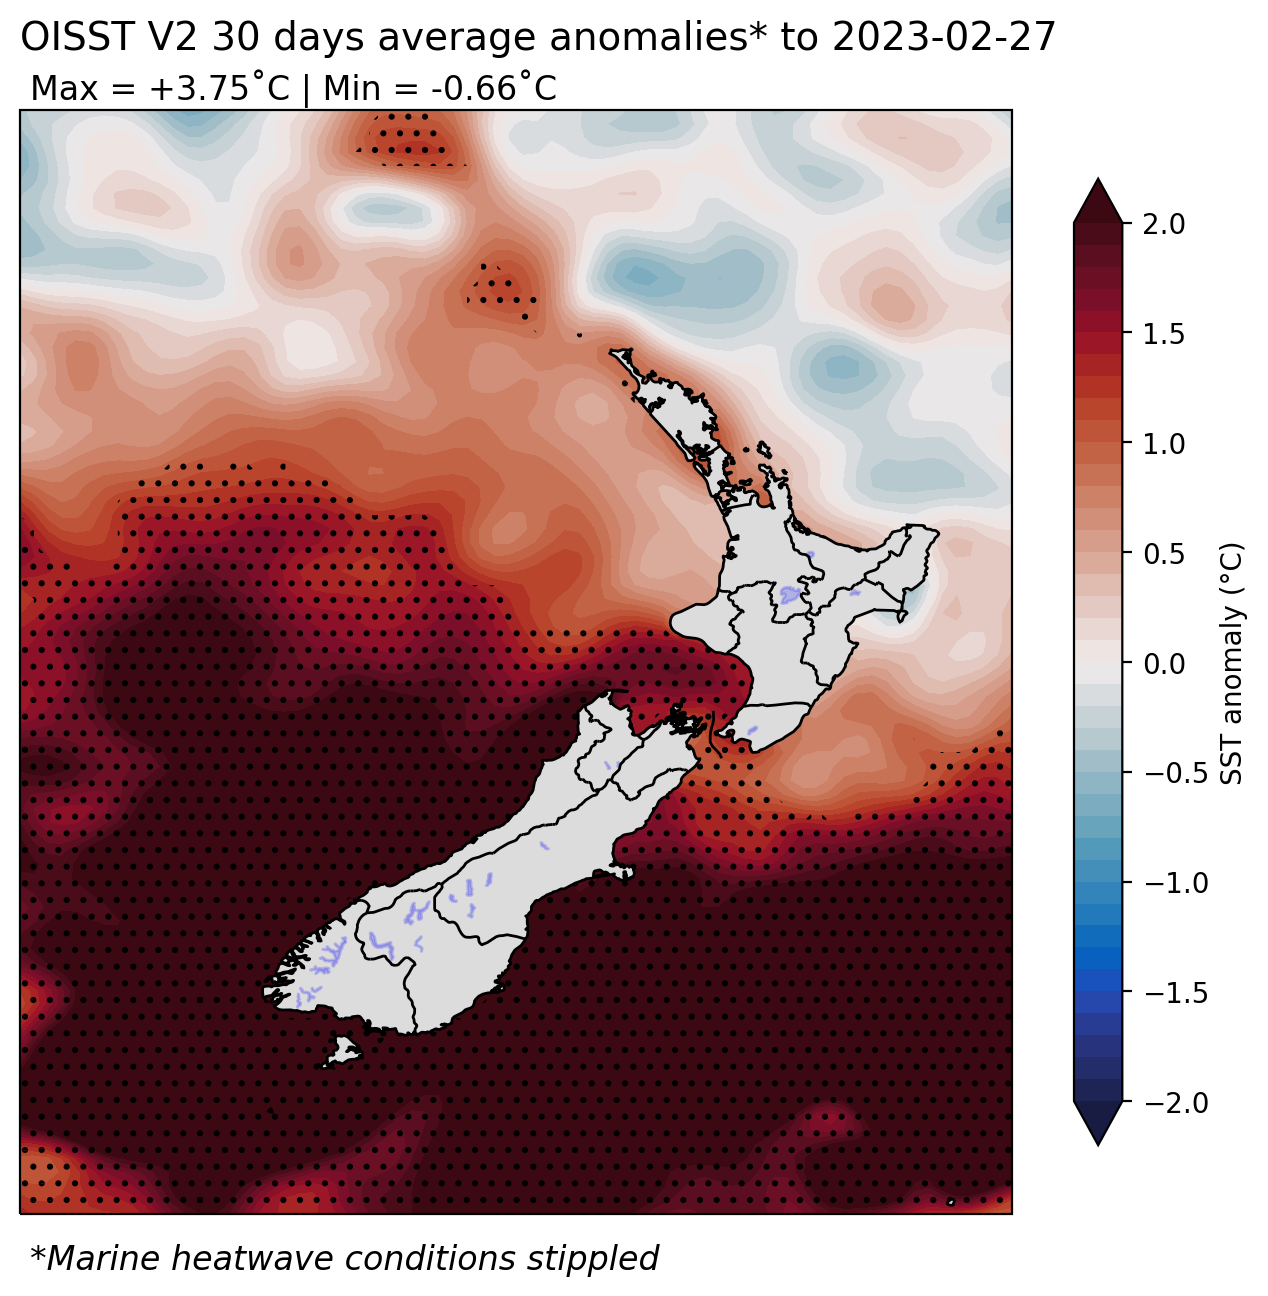
Figure 1: 30-day SST anomalies and marine heatwave conditions (stippled), calculated with respect to the 1991-2020 climatological period.