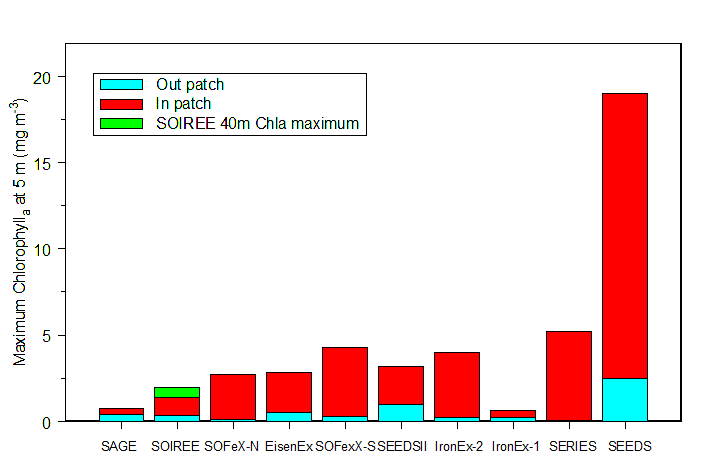
Plot comparing the response of the phytoplankton (as maximum chlorophyll-a) with the response in other iron experiments. Red bars indicate the chlorophyll-a inside the iron-enriched patch and the blue bars the chlorophyll-a in waters outside the patch (Harvey et al, 2011).