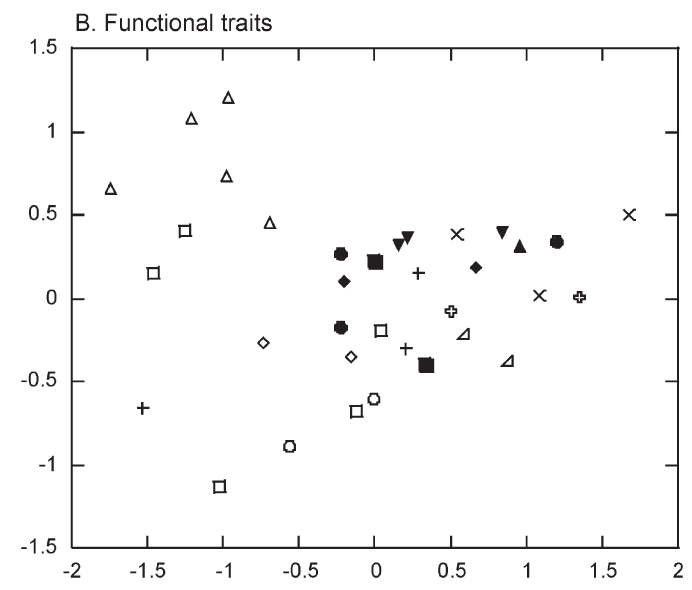
Figure 4: non-metric MDS plot showing that trait differences between habitats (represented by different shapes) within a location are greater than the differences between two locations (filled vs non-filled). [Hewitt et al, 2008].
Figure 4: non-metric MDS plot showing that trait differences between habitats (represented by different shapes) within a location are greater than the differences between two locations (filled vs non-filled). [Hewitt et al, 2008].