On 1 July 2025, NIWA merged with GNS Science to become Earth Sciences New Zealand.
Link to source page
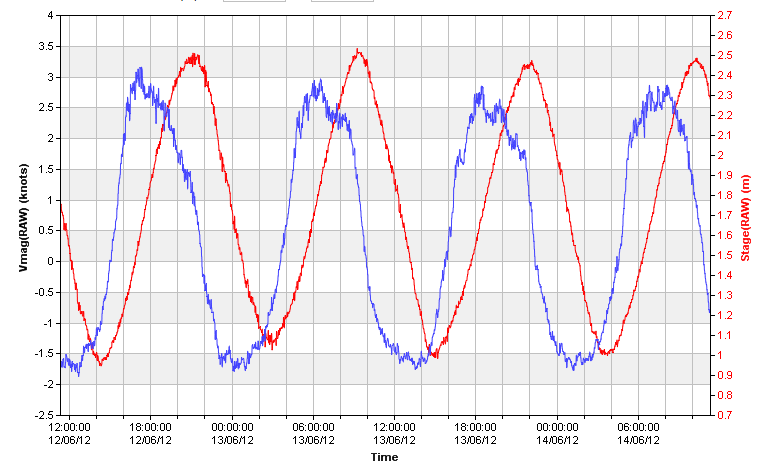
Data is only a click away. Clicking on the parameters you are interested in brings up a table or graph of data over any period of time you choose. This graph shows sea level (red) and tidal current (blue) over two days.