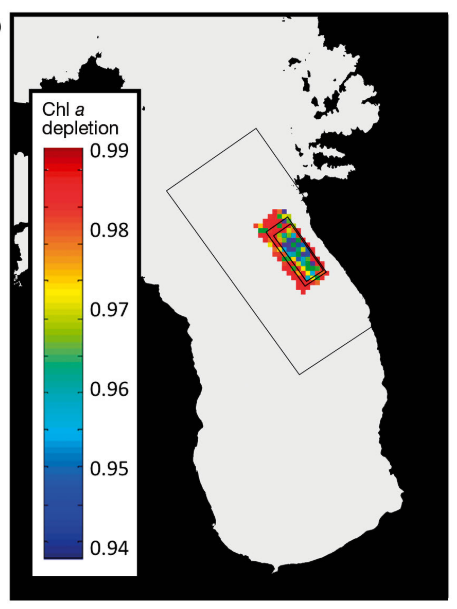
Figure 1: illustration of the estimated concentration of chlorophyll in the presence of the marine farm relative to that prior to the farming-area’s development. A value of 1 indicates no depletion. A value of 0.94 indicates 6% depletion. The inner-most black rectangle is the 1200 ha marine farming zone. The middle rectangle has an area that is 50% larger than the central one. The outer rectangle demarcates the maximum area to which the analysis initially assumed a farm influence may extend. Ultimately, the analysis revealed that the influence extended only to about central rectangle.