Graph: ESR
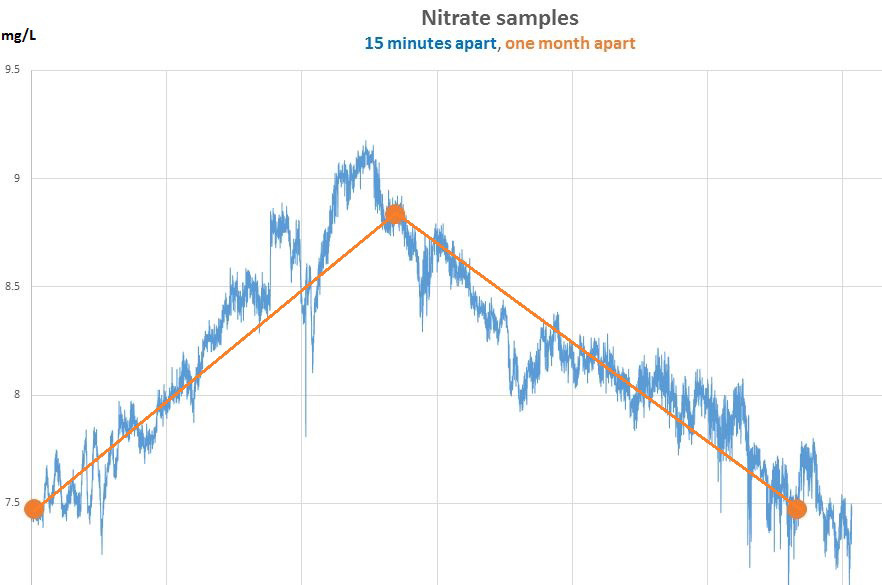
A real data example showing the ‘information’ lost by infrequent sampling. The monthly value (orange trace) under-represents the peak by 5% and provides little indication of how nitrate concentration varies cyclically or with flow dynamics.