NIWA
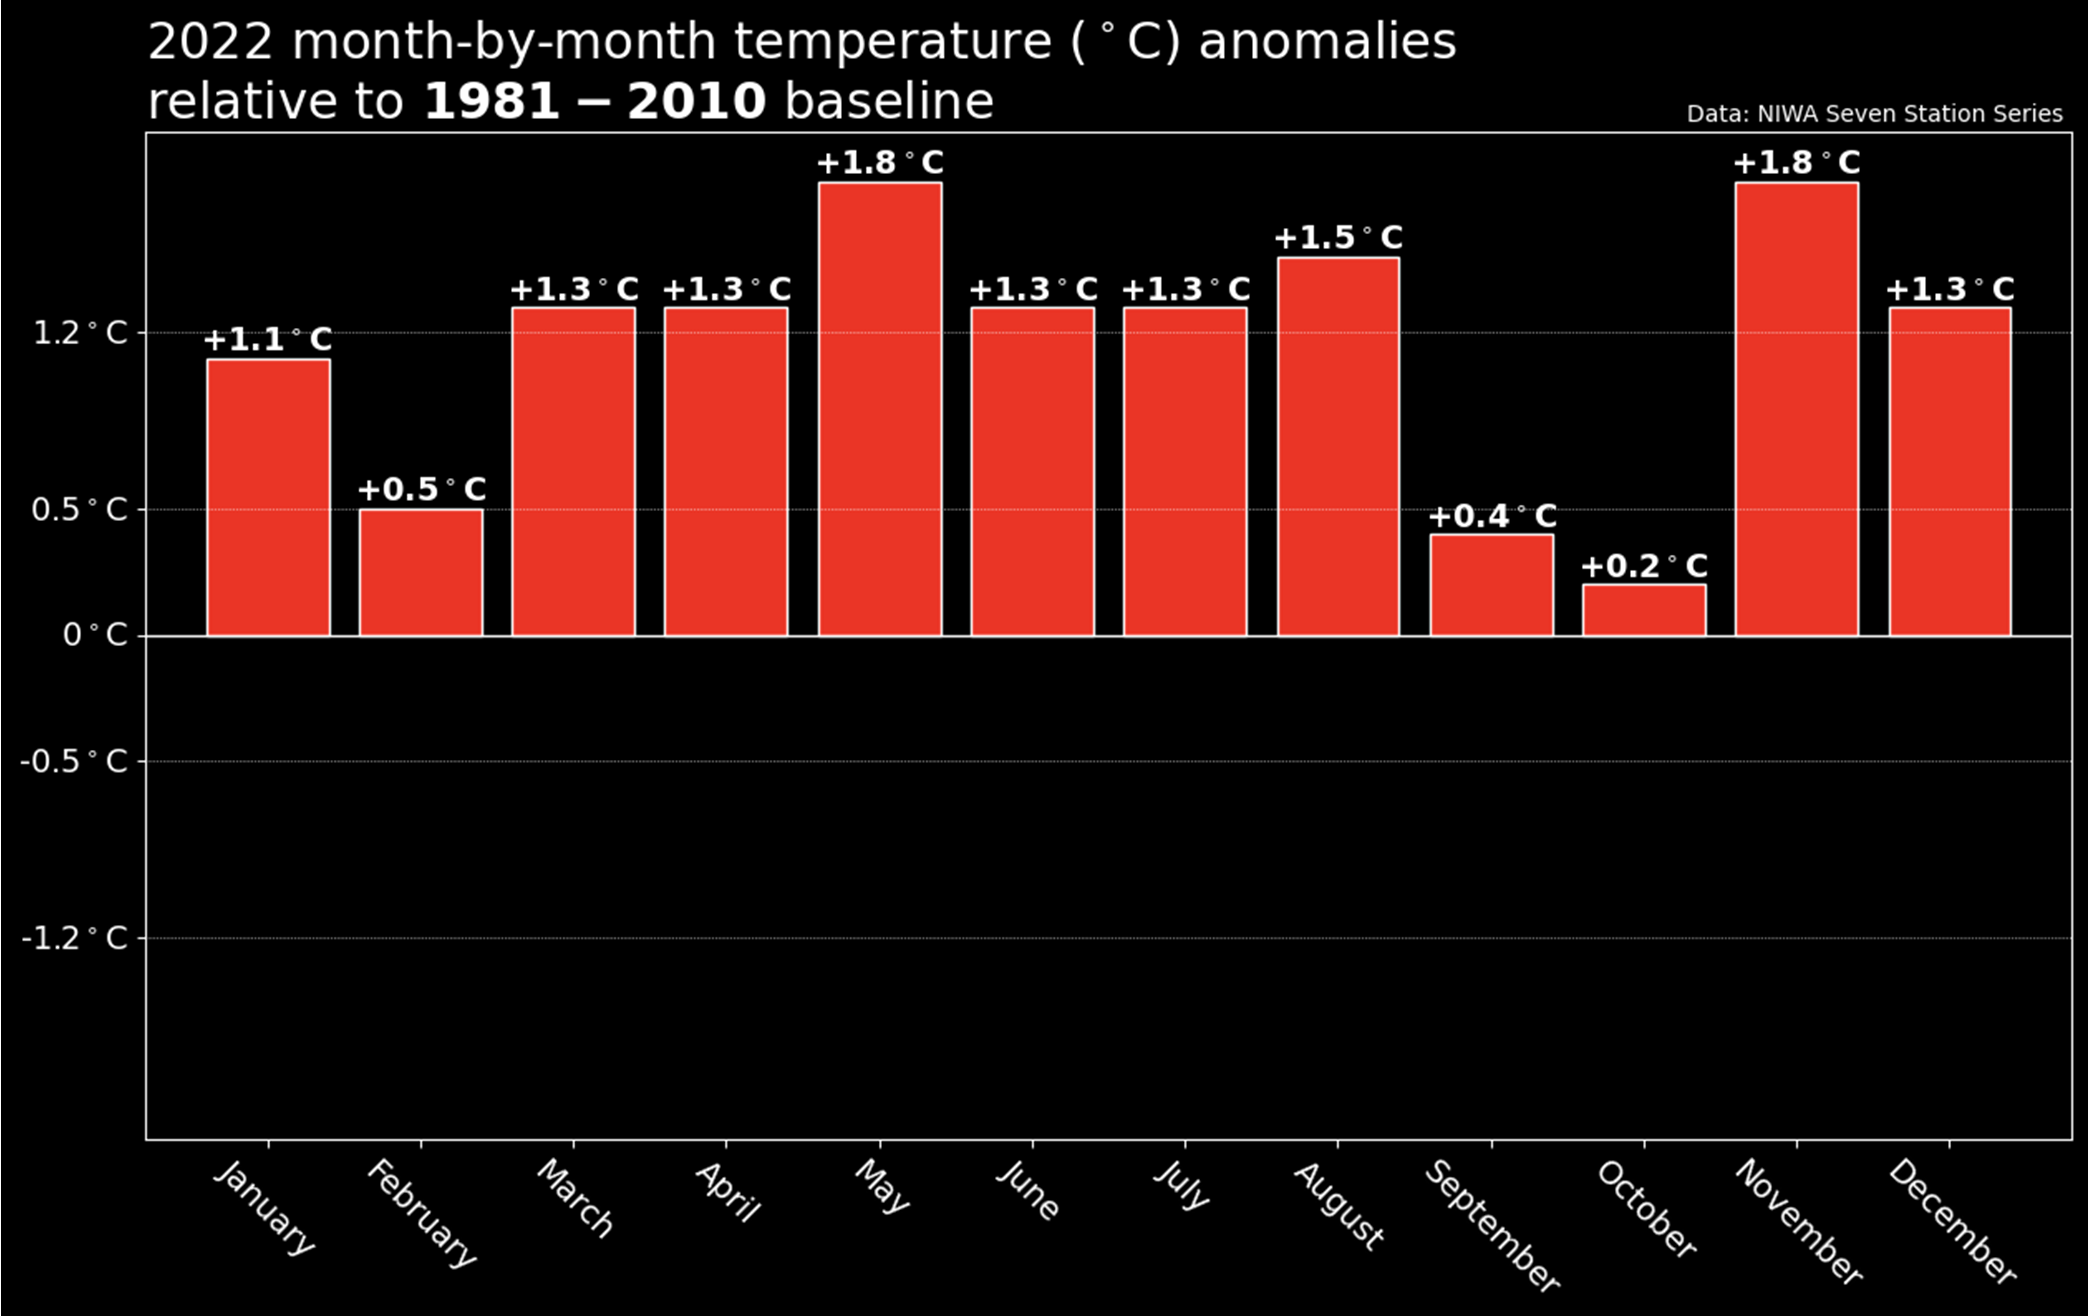
Figure 3: Monthly temperature anomalies calculated from NIWA's seven station series. All bars are red, indicating that no month had an anomaly below 0°C. Values above 0.5°C are considered “above average”, while values above 1.2°C are considered to be “well above average”.

