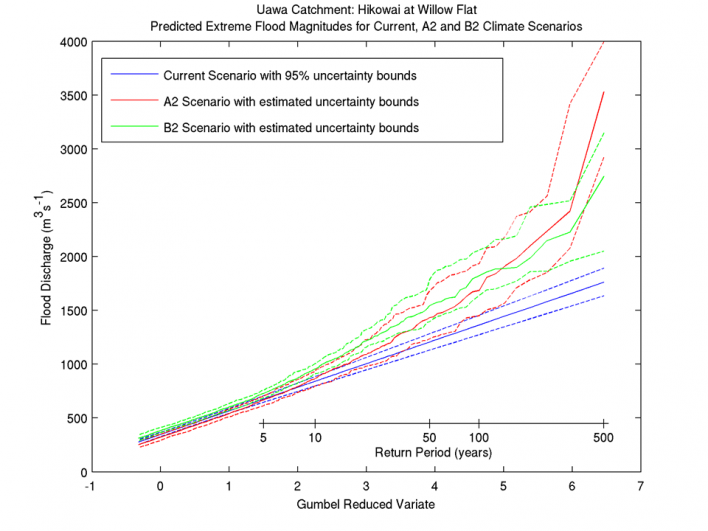
Figure 3: Absolute changes in flood frequency for return periods up to 500 years, under A2 and B2 climate change scenarios for Willowbank gauging station in the Uawa catchment. Solid lines show median predicted values; dashed lines show uncertainty bounds.