On 1 July 2025, NIWA merged with GNS Science to become Earth Sciences New Zealand.
Link to source page
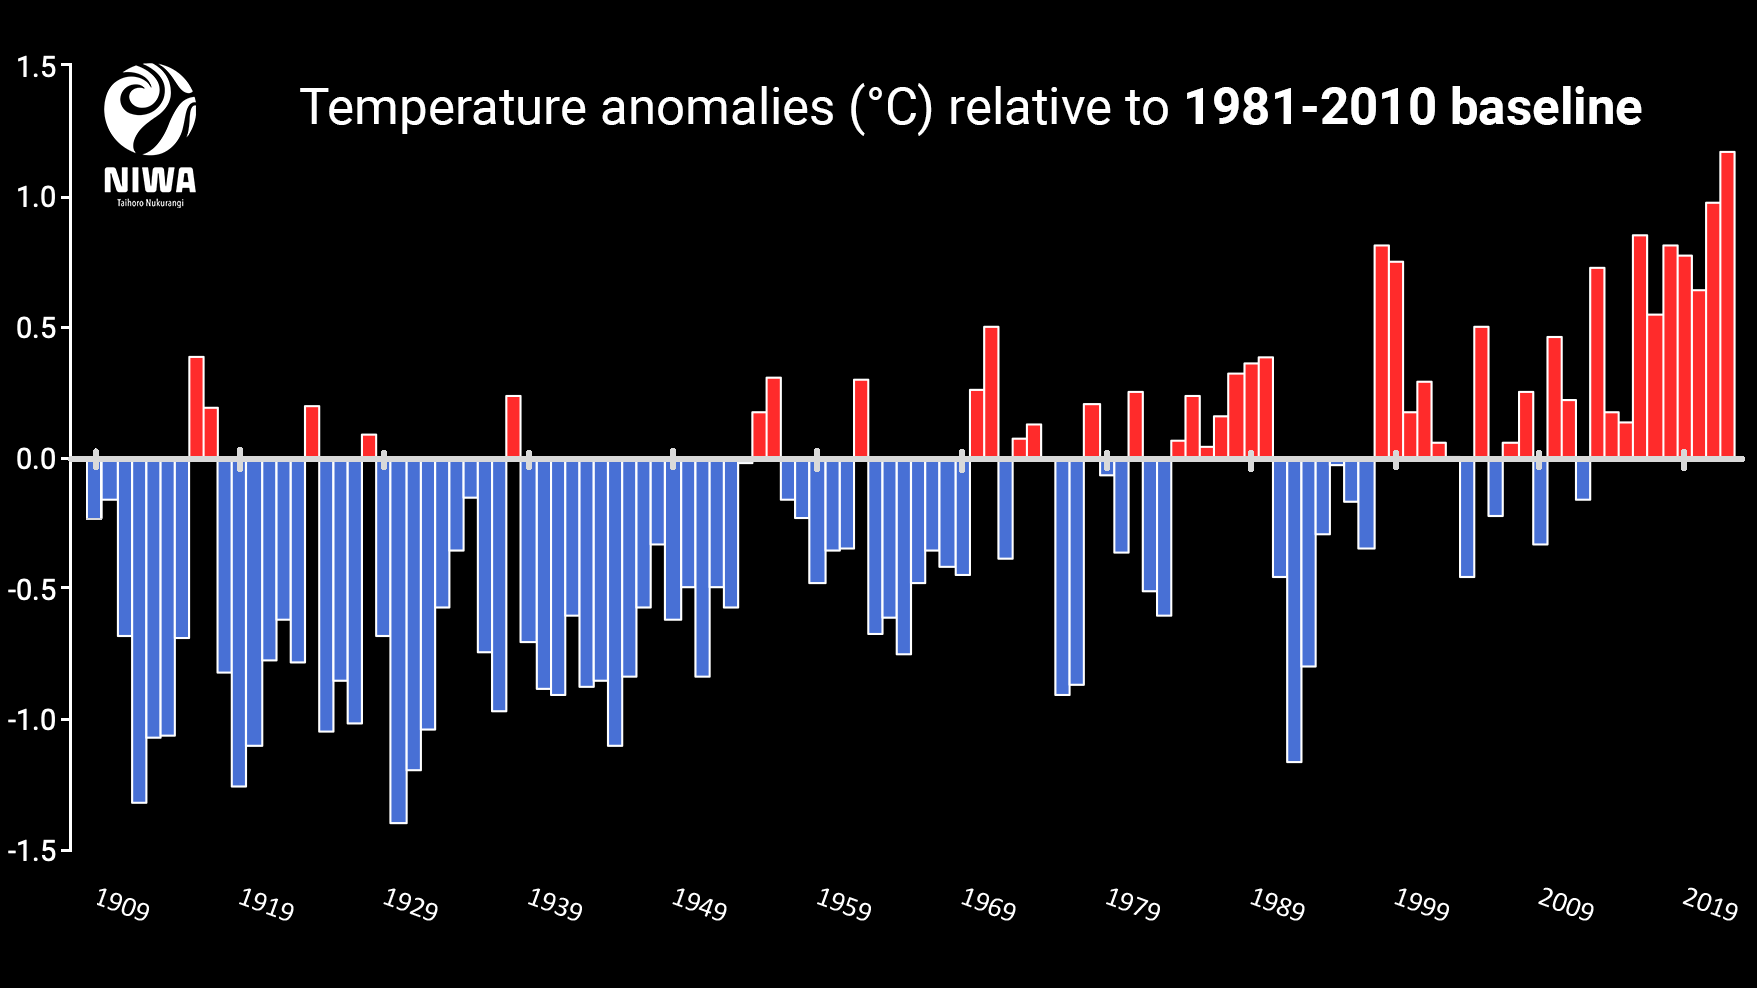
Figure 2: Temperature anomalies from NIWA's seven station series from 1909 to 2022. Blue indicates temperatures colder than the 1981-2010 baseline, red indicates temperatures warmer than the 1981-2010 baseline.