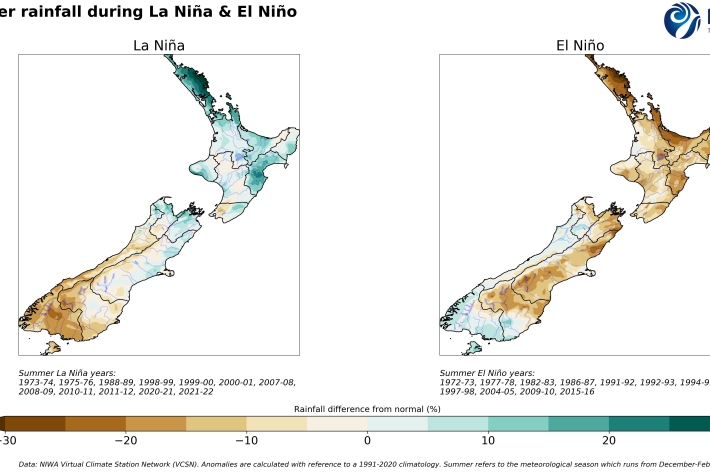
Maps showing how summer rainfall has differed during strong El Niño events.
These maps show how New Zealand’s summer rainfall differed from normal during three strong El Niño events. The last map shows the average rainfall anomaly during El Niño and La Niña summers. For more information, refer to our main ENSO page.

