The issue
Excessive nutrient input (eutrophication) threatens many New Zealand estuaries causing ecological problems, such as algal blooms and poor physical and chemical conditions for estuarine life. The problems arise because the nutrients affect the trophic condition of the estuary, essentially, overfeeding algae, causing very high growth and then poor oxygen and other conditions as the algae respire and decay. Until recently, guidance on how to assess the extent of eutrophication was limited. This made it difficult to determine the current trophic state of estuaries, or to assess the impact of freshwater nutrient loads on estuary trophic state. In turn, this has made it challenging to predict the consequences for estuaries of management decisions regarding land-use, point source discharges or setting nutrient limits for upstream environments.
The Solution
To respond to these challenges, regional councils worked with NIWA to develop the Estuary Trophic Index (ETI) project, using the ‘Envirolink Tools’ facility of the Ministry of Business, Innovation and Employment (MBIE). The ETI was delivered by a team comprised of NIWA marine ecologists and modellers, Wriggle Coastal Management, regional council coastal scientists and Hume Consulting.
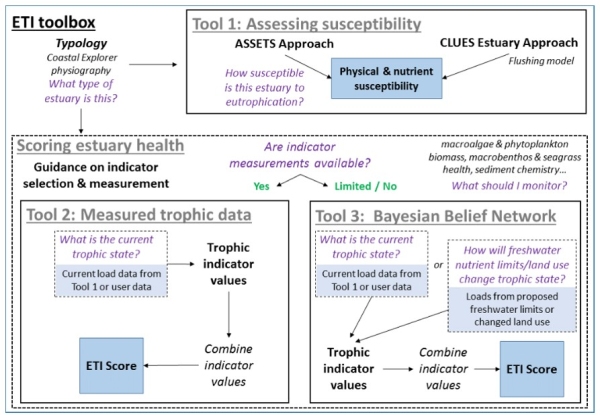
The purpose of the ETI is to provide ‘a nationally consistent approach to the assessment and prediction of estuary eutrophication’. Three ETI tools were built, enabling users to:
- determine the susceptibility of an estuary to eutrophication,
- assess estuary current trophic state, and
- assess how changes to upstream nutrient loads may alter trophic state and components of the estuary ecosystem.
The ETI tools provide information on estuary eco-morphological type and appropriate monitoring indicators for measuring estuary ecological state. They enable users to score the estuary, along an ecological gradient from minimal to high eutrophication, using empirical relationships and nutrient models that link the ecological expressions of eutrophication (measured using appropriate trophic state indicators) with nutrient loads. The tools have been coded in web-based applications for users, at the addresses given below. The apps provide the users with instructions for use of the tools, and background material and references describing their underpinning science.
The Results
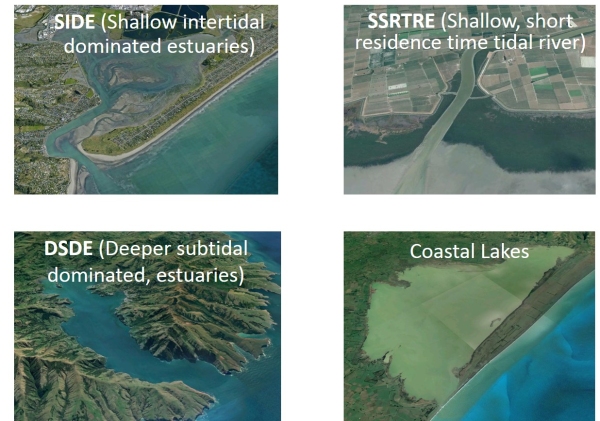
The ETI provides information on 443 New Zealand estuaries, covering their full range of estuary sizes and physical and ecological types. The tools recognise that our estuaries respond to eutrophication differently depending on their eco-morphological type, by categorising them into four major divisions. This typology enables the ETI to account for estuary diversity by, for example, recognising the differing likelihoods of macroalgal vs phytoplankton blooms between lagoon and river-type estuaries, and by recognising that some estuaries are intermittently closed or open to the sea, a feature which strongly influences eutrophication susceptibility.
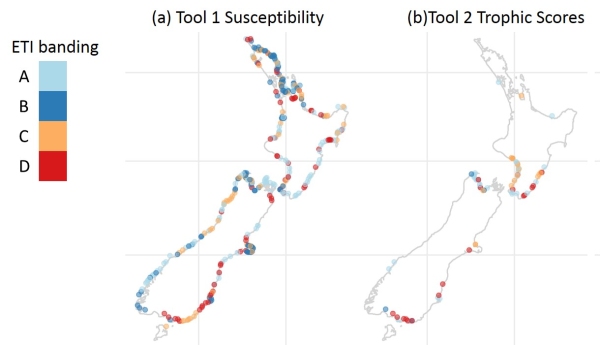
Example results from Tool 1 maps susceptibility of 382 estuaries to eutrophication, nationwide. This model run assumed that all estuaries were open to the sea, but a user can include information on closure duration if known. The modelling accounts for the percentage of each estuary that is intertidal, a strong determinate of relative susceptibility to macroalgal or phytoplankton impacts.
Tool 2 of the ETI provides methods to calculate an ETI score for an estuary. Tool 2 identifies appropriate trophic indicators for users to monitor and gathers international and local knowledge on indicator states that describe ecological condition. It combine scores for the primary indicators of eutrophication (macroalgae and phytoplankton abundance) with the secondary indicators or ‘symptoms’ of eutrophication (e.g. compromised invertebrate communities, poor sediment conditions, seagrass loss) to estimate the final ETI score. To date, scores for 82 estuaries are available, nationwide.
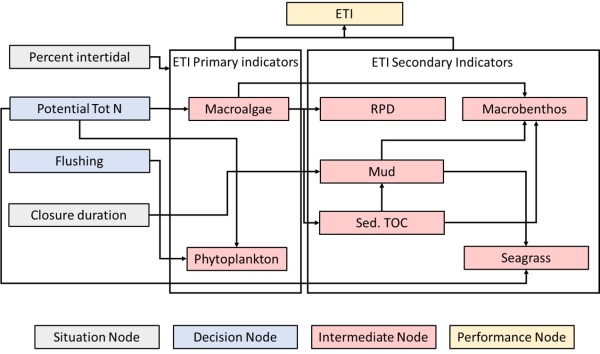
Tool 3 is a Bayesian Belief Network (BBN) that connects information on drivers of estuary trophic condition (e.g., nutrient concentrations or flushing rate) with responses of indicators, to calculate ETI scores. It uses knowledge about linkages between drivers (Situation and Decision nodes) and indicators (Intermediate nodes) to determine the states of indicators and the final ETI score (Performance node). The user inputs information on the drivers (available from Tool 1) to run the model. The user may also input any information available for Intermediate node indicators to improve the BBN’s accuracy.
The BBN is particularly useful when little information is available on indicator states or when the user wishes to test scenarios. The results below show an example of effects on the Intermediate node trophic indicators and the final ETI score of a scenario in which nutrient loading was reduced in a SIDE-type estuary.
Example BBN results for a SIDE (lagoon) estuary comparing ETI outcomes under present-day nitrogen concentrations (determined from Tool 1) with outcomes under a nutrient reduction scenario.
|
Estuary indicator states |
Current N |
Reduced N |
|
Potential N (mg/m3) |
600 |
100 |
|
Flushing (d) |
3.6 |
3.6 |
|
Percent intertidal (%) |
42 |
42 |
|
Closure (open/short/long) |
Open |
Open |
|
Macroalgae Ecological Quality Rating |
0.4 |
0.7 |
|
Sediment carbon (%) |
3.4 |
1.4 |
|
Redox potential (mV) |
-250 |
+80 |
|
Macrobenthic health (AMBI index) |
4.8 |
2.3 |
|
ETI score and band |
0.87 D |
0.48 B |
Conclusion
The ETI tools applications are freely available at the web addresses given below. Their pages provide instructions on use of each tool and the knowledge underpinning them. They provide data for many New Zealand estuaries, as well as templates for users to input new or updated data for estuaries of interest.
We hope that use of these tools over time by coastal resource managers will lead to a broader information database on our estuaries, better capacity to assess and predict estuary health and, ultimately, improved outcomes of estuary sustainability.
382, 5556


