We are using modern techniques to map the seafloor surrounding Kapiti Island, an area of significant cultural and environmental value to New Zealand.
Bathymetric and seabed habitat maps are prerequisites to proper management and to date there has been no extensive modern mapping of the region. Our work will produce a portfolio of maps of the shape, geology and habitat of the seafloor around Kapiti. Thus helping to integrate Kapiti Island into the surrounding marine realm and local community.
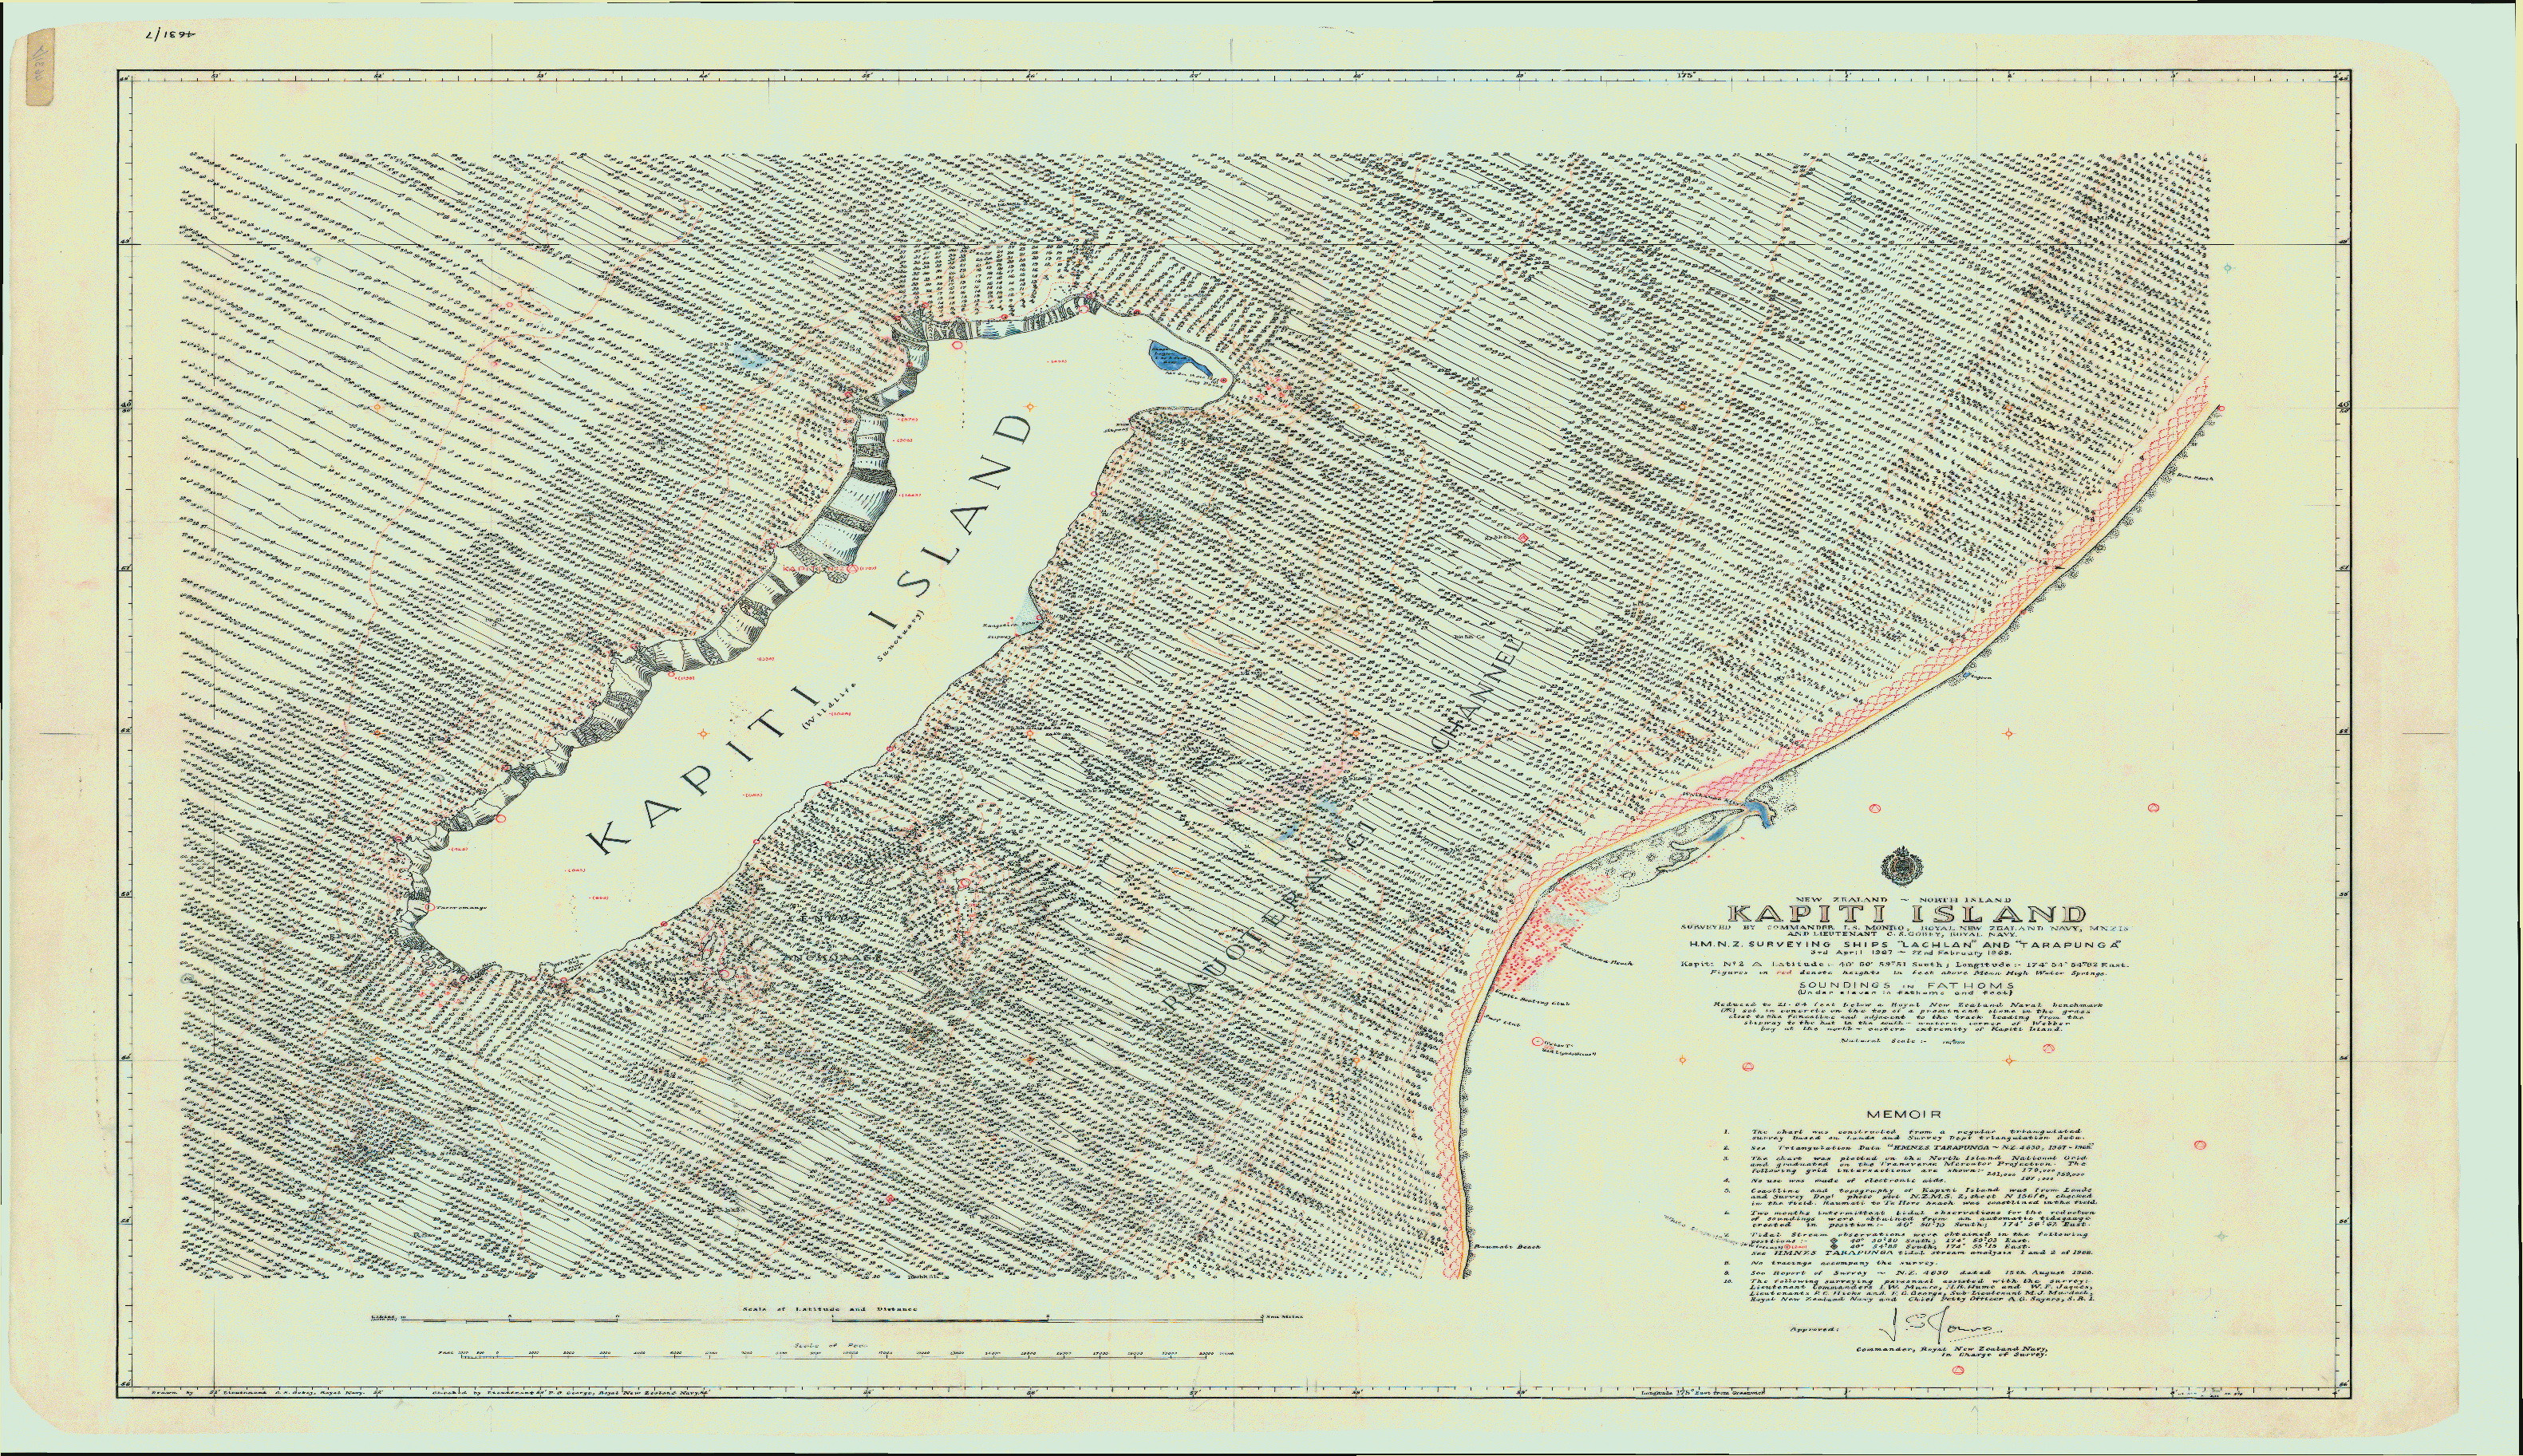
Kapiti Island geography
Kapiti Island is located only 30 km from Wellington. The Kapiti Island Marine Reserve was established in May 1992 and is divided into eastern and western sections. The eastern section of 1825 ha extends across to the mainland adjacent to the Waikanae Estuary Scientific Reserve. This passage between the mainland and Kapiti Island is characterised by a 70 m-deep channel that experiences strong currents and until the turn of the twentieth century a well-known passage for whales. The western seaward component covers 342 ha and encompasses a dynamic and rugose sea floor that creates suitable habitat for a diverse and abundant group of fish and iconic invertebrates such as paua and rock lobsters. The Kapiti Island Marine Reserve provides popular recreational dive locations. The geology surrounding Kapiti Island is dynamic with several active faults running along both sides of the island.
Multibeam mapping
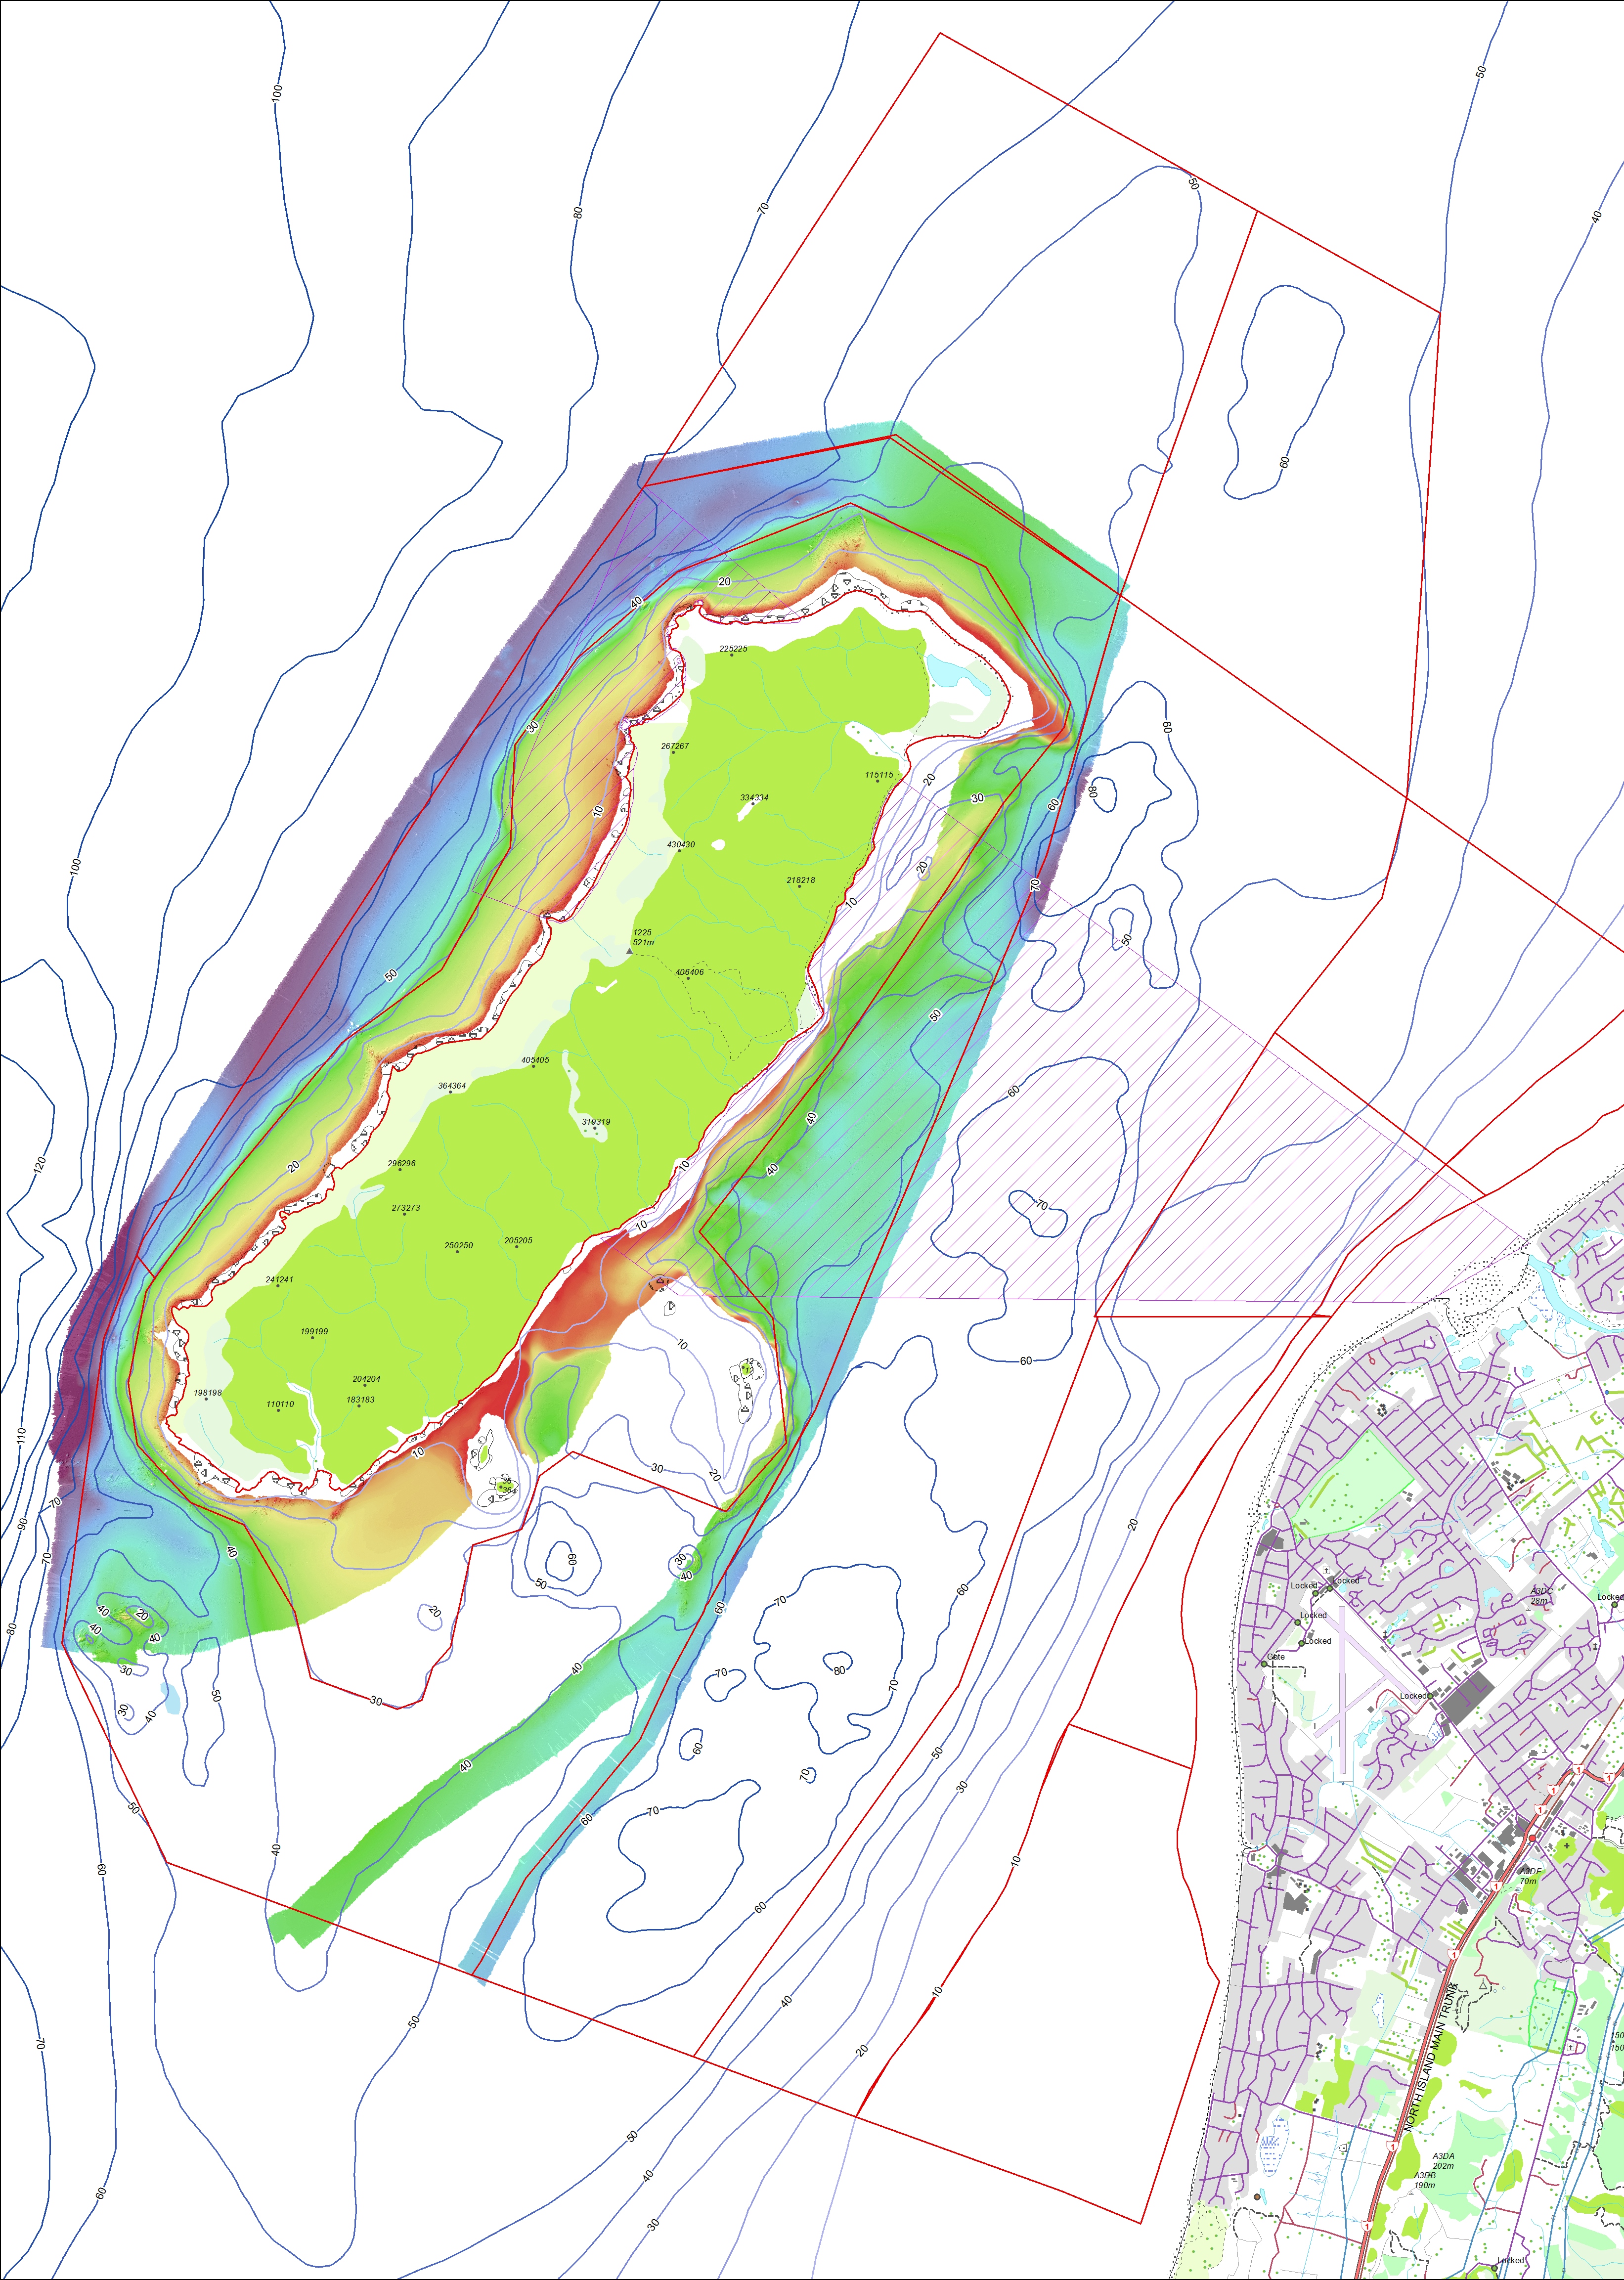
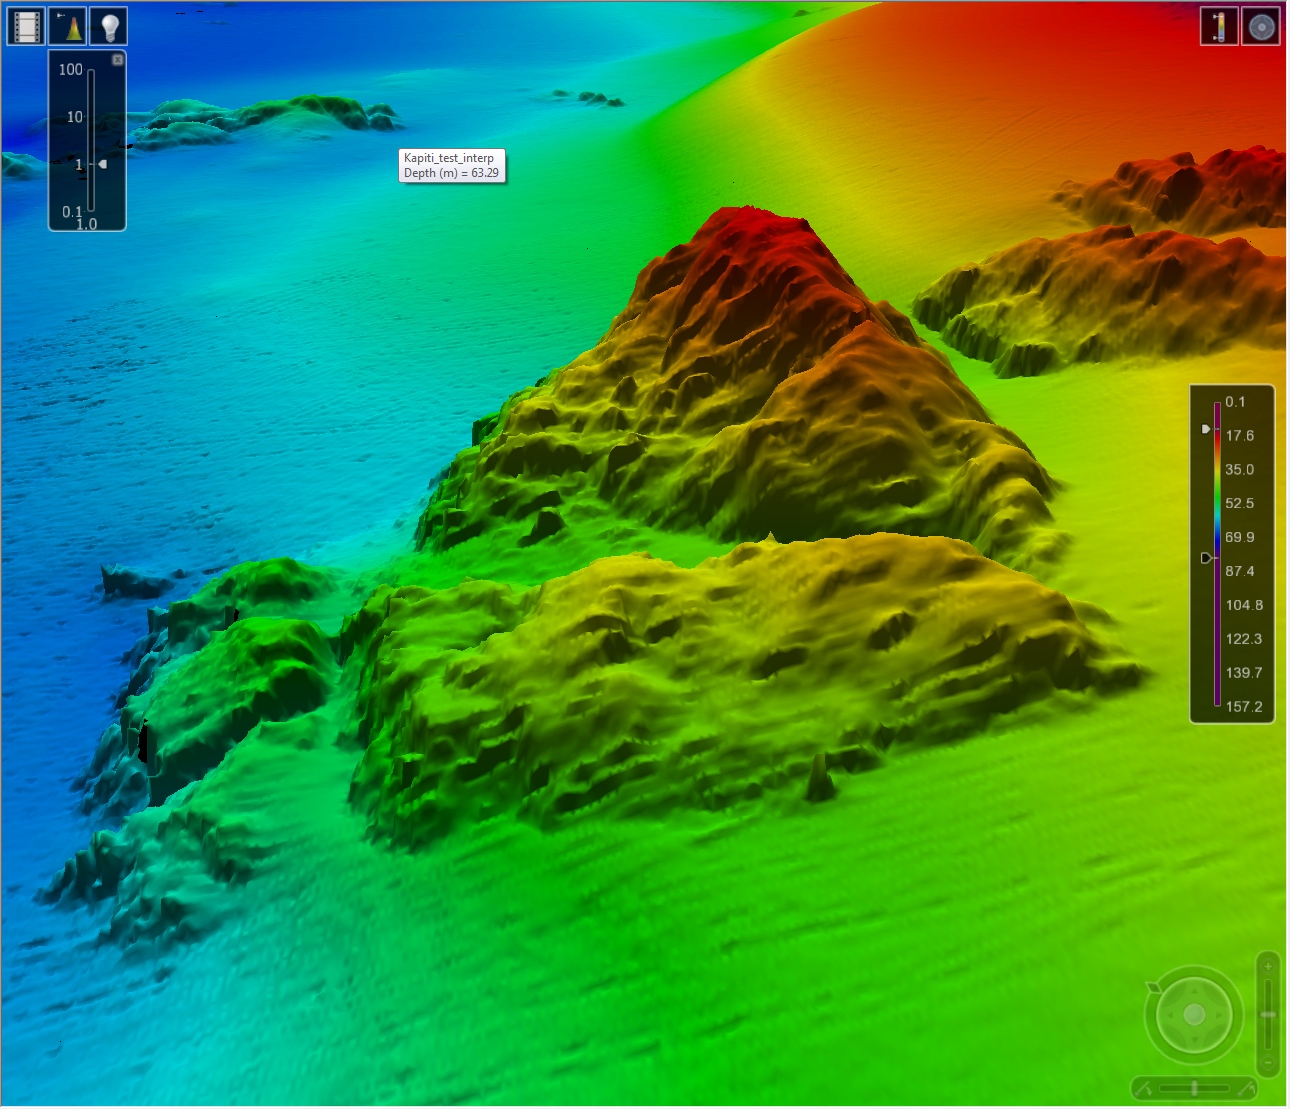
Today, details of seafloor morphology are collected by multibeam echo-sounders that provide 100% coverage with sub-metre accuracy and quantitative information on seafloor substrate. Amazingly, no such data have been collected around Kapiti Island to date. Information about the seafloor morphology around Kapiti dates from the late 1990s and has a low level of accuracy. In this project we use a Kongsberg EM2040 multibeam installed on NIWA's 14 metre-long catamaran RV Ikatere.
While bathymetry data reveal the shape and depth of the seafloor, the strength of the return signal (backscatter or imagery) provides valuable information on the bottom types and habitats. In addition, data recorded throughout the full water column (from echo-sounder to seafloor) can be used to characterise habitat type and water masses, identify seeps and plumes, detect fish schools and other features not normally imaged in the bathymetry data.
Mapping outcomes
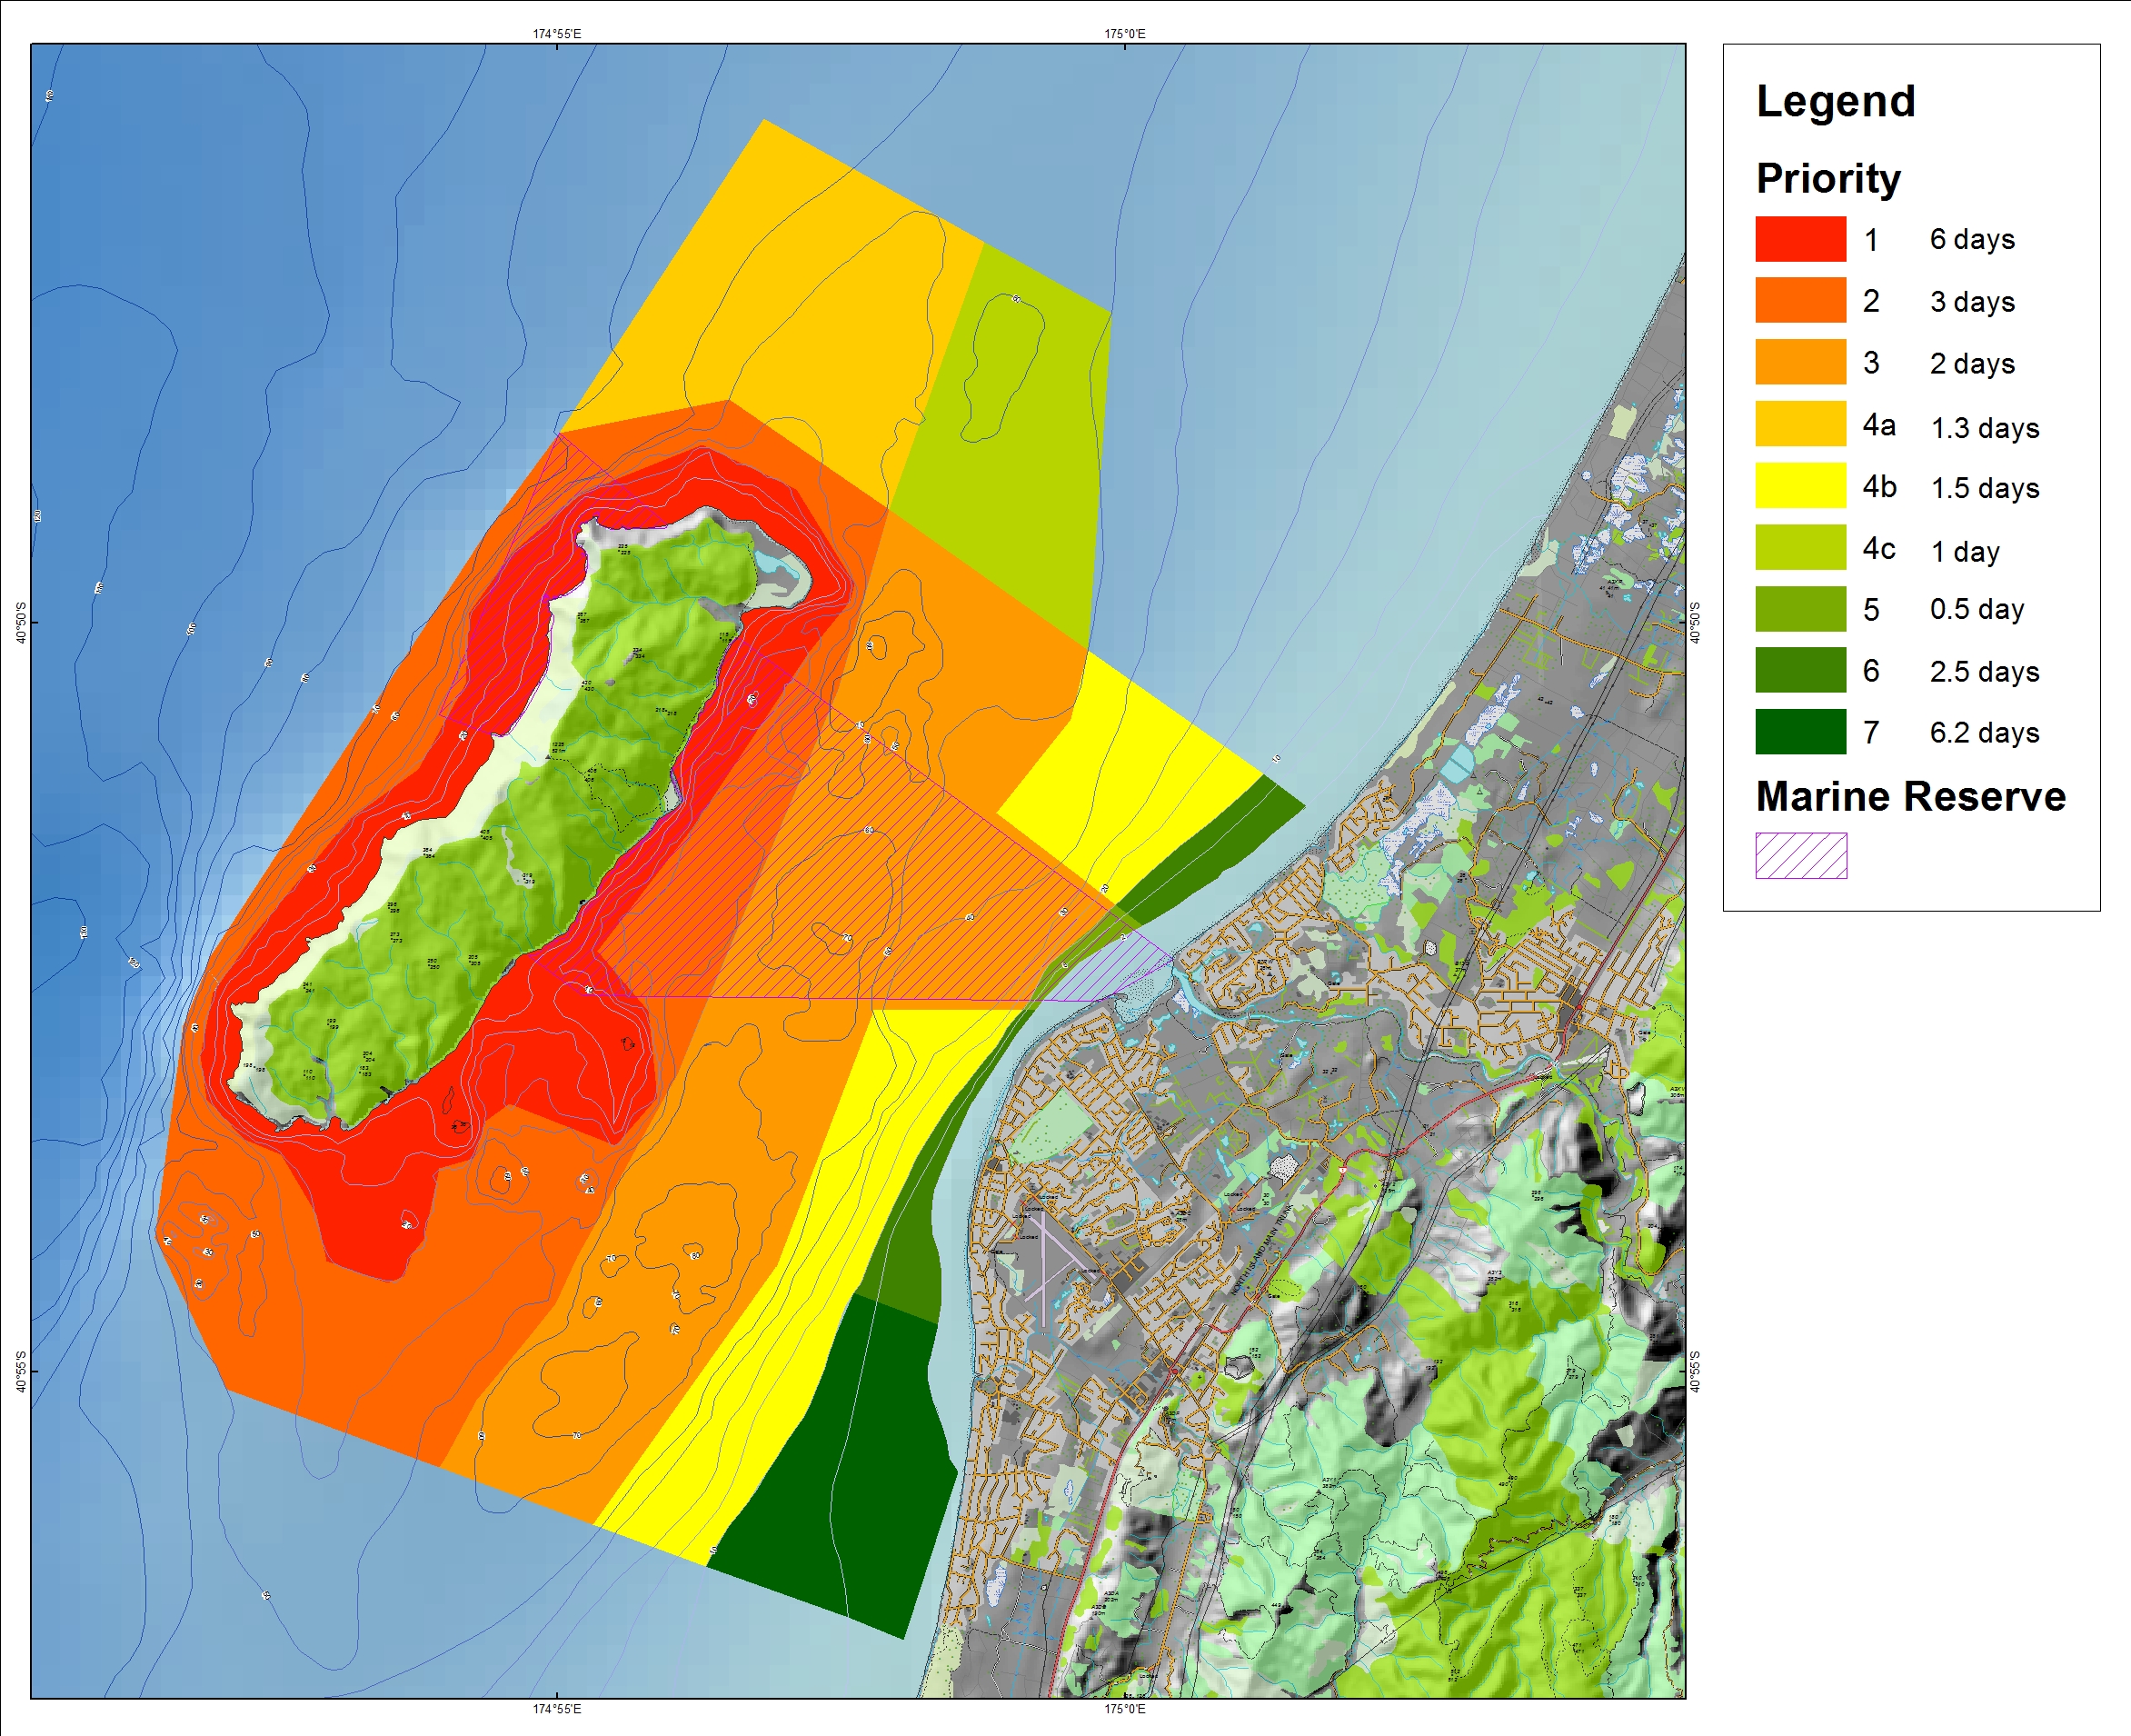
The objective is to map the seafloor around Kapiti Island to at least 50 m of water depth, including the marine reserve area. The project is funded by NIWA, Victoria University of Wellington, the Department of Conservation (DOC) and Land Information New Zealand (LINZ). It is supported by Greater Wellington Regional Council and Ngati Toa Rangatira.
Mapping started on Friday 5 June and is progressing well despite the wintery conditions. On Friday 19 June we have completed 5 days at sea and mapped ~33km2 around and close to the island, the western parts of our priority one and two mapping areas covering the western side of the island. The amount of data collected so far uses ~222 Gb of disc space. There are approximately 7 days of mapping remaining. The next priority is to complete mapping to the southeast of the island, the northern part of the island, and then between the island and the mainland. The definition of the data is outstanding, we can image blocks on the seafloor that are around 1 m in size and once the data are post-processed we will increase this resolution to objects less than 50 cm in size in water depths of 20 m. As the winter swells allow the mapping project to continue we will update our mapping progress.
Once mapping is complete the map products produced can be used to effectively manage the area and promote awareness of the richness, diversity and complexity of the seafloor of the Kapiti Island region and the biota it supports. Information will also be used by LINZ for the next update of the region’s navigational charts.
Kapiti multibeam survey video
Further information
External People Involved
Professor Jonathan Gardner - Victoria University of Wellington
Alix Laferriere - Victoria University of Wellington
Shane Geange - Department of Conservation
Stuart Caie - Land Information New Zealand