-
Common climate and weather terms
Education ResourceA glossary of common climate change and meteorological terms. -

UVI smartphone apps
Several apps that provide forecasts of the UV index (UVI) are available for smartphones. -
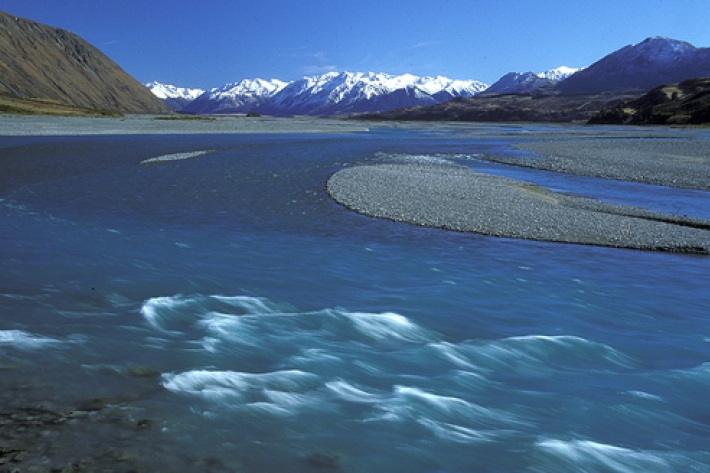
Climate and weather
Information about climate and weather and links to climate-related websites. -
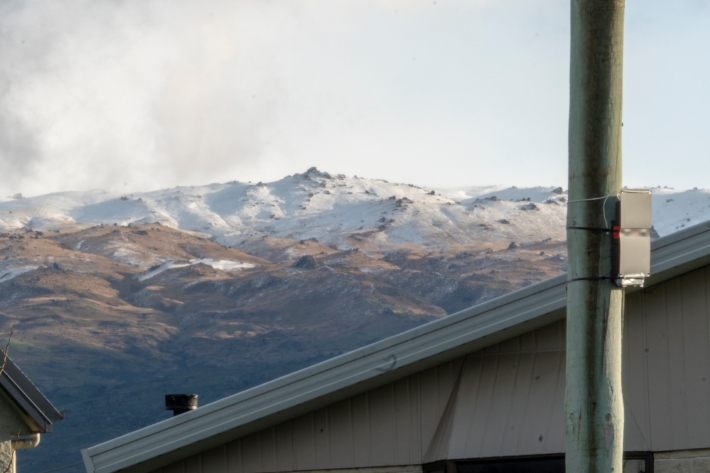
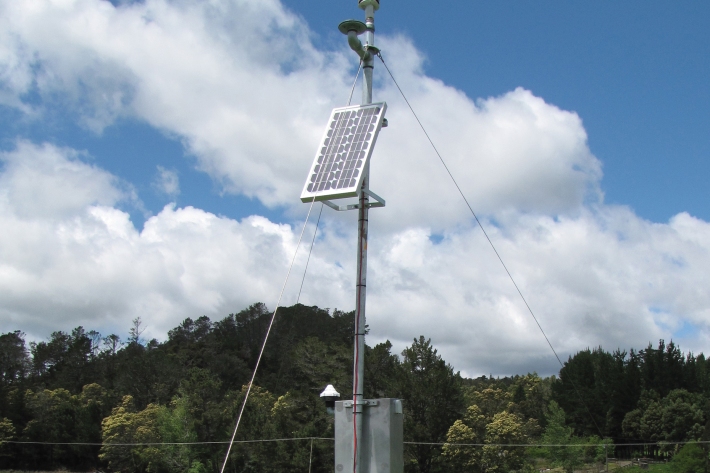
Air quality monitoring with low-cost sensors
ServiceNIWA provides ambient air quality monitoring services using low-cost ODIN (Outdoor Dust Information Node) sensors. -
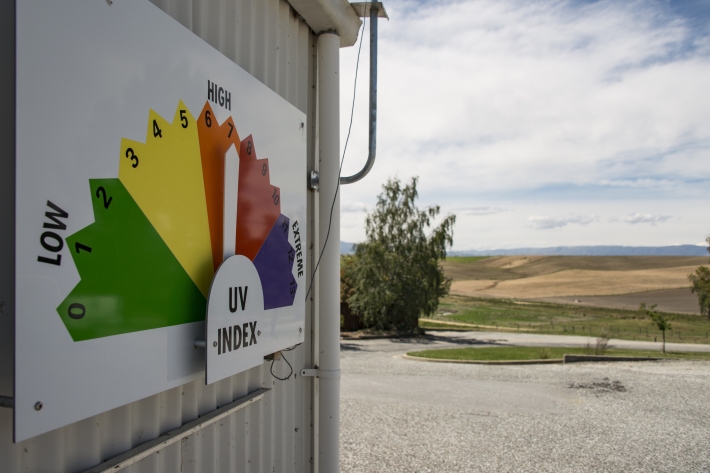
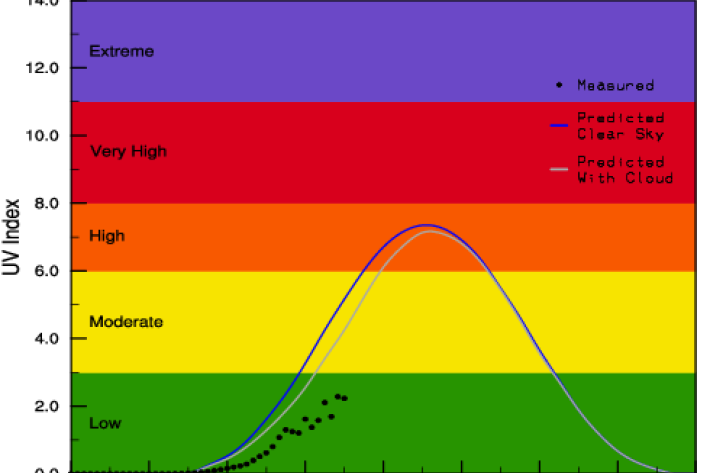
UV Index Information
Education ResourceThe UV Index is a measure of the intensity of UV radiation. The UV Index supersedes the idea of "Time to Burn" or "Burn Time", which has been used previously in New Zealand. -
Common hydrological terms
Education ResourceDescriptions of the common terms that explain the processes that occur in hydrology. -
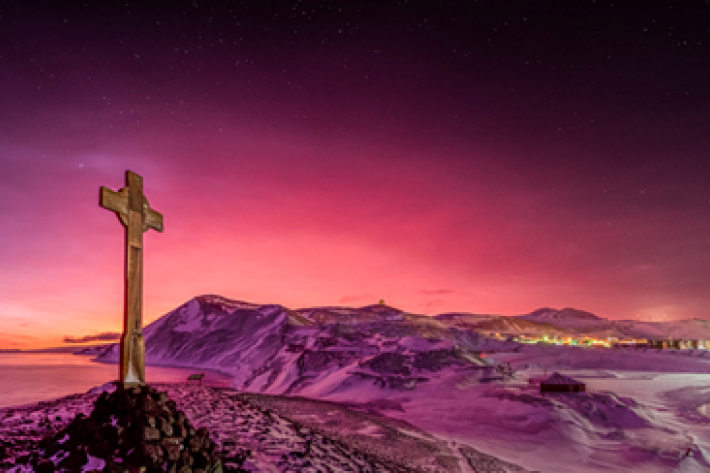
Tonga volcano “afterglow” causes dazzling skies in Antarctica
Media release06 June 2017Antarctica is experiencing stunning skyscapes like those recently seen in New Zealand, thanks to the afterglow effect from the Tongan volcano. -
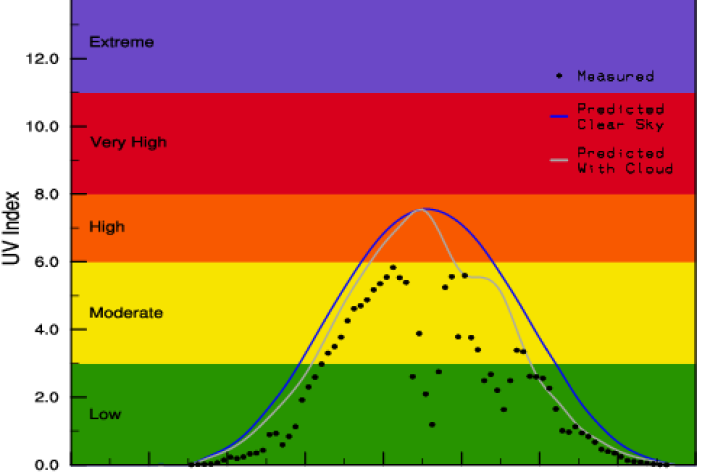
Yesterday's UV Index
Plots of UV levels throughout the day at different locations. -
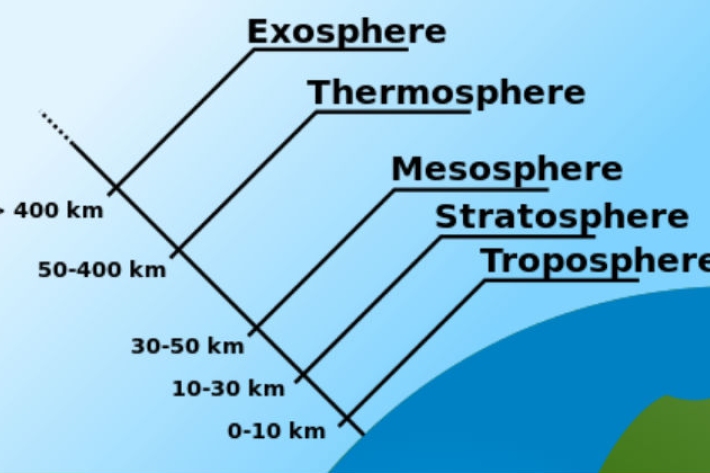
Layers of the atmosphere
Education ResourceThe atmosphere is comprised of layers based on temperature. These layers are the troposphere, stratosphere, mesosphere and thermosphere. -
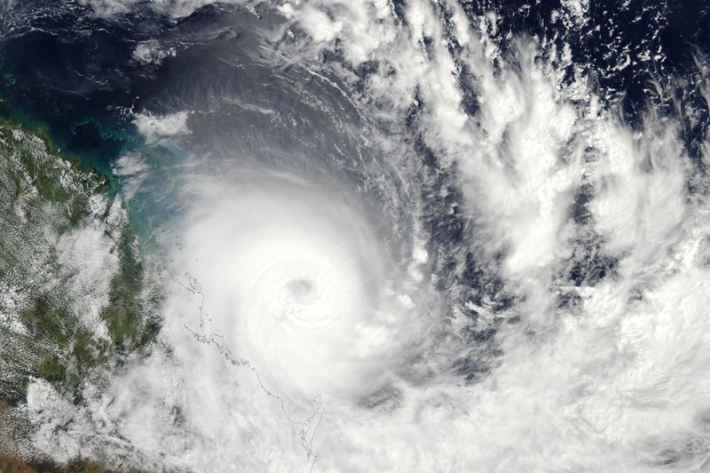
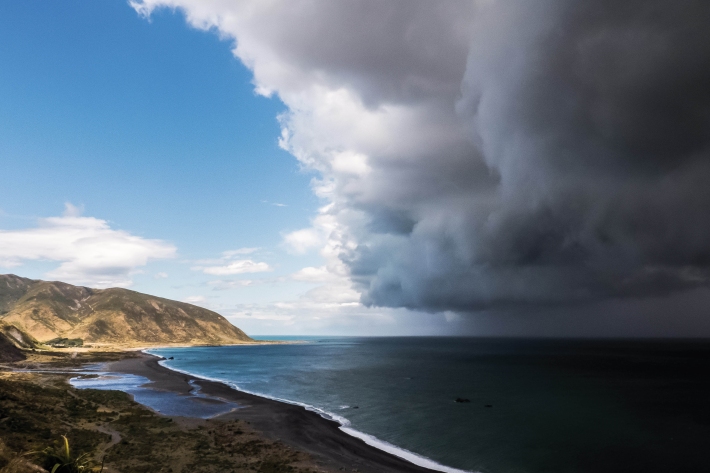
Storms and cyclones
Education ResourceCommon questions about storms and cyclones in New Zealand. -

Climate change, global warming and greenhouse gases
Climate data and common terms explaining the causes and effects of climate change.