Summary of results: indoor air quality
Thirty ‘Hau-Hau’ indoor air quality sensors developed by Massey University and NIWA were deployed in Arrowtown homes between June to October 2019. These successfully collected sufficiently high-quality data about indoor air quality from 70 homes across the town.
For 28 of these homes where indoor and outdoor air pollution concentrations were high enough, it was possible to estimate the relative contribution of indoor and outdoor sources of pollution on indoor air quality. In these homes, pollution from outdoor sources infiltrating into the home tended to make a larger contribution to poor air quality inside the home than indoor sources (such as smoke leaking directly from a wood burner).
There was a very large variation in indoor air quality between homes (ranging from 1 to 22 micrograms per m-3 of PM2.5, or particulate matter smaller than 2.5 microns). This was largely due to the big variation in outdoor air quality across the town (see more about this below).
Read the full report detailing results related to indoor air quality from Arrowtown in 2019.
Summary of results: outdoor air quality
In Arrowtown in 2019 NIWA deployed 22 prototype ambient air quality sensors (ODINs) in a distributed grid across the town between June and mid-August. More sensors were added in August and September, reaching a maximum of 48.
Although the official (Otago Regional Council) record shows that on cold winter nights Arrowtown has some of the most polluted air in the country, exceeding National Environmental Standards multiple times per year, NIWA’s network of distributed monitors showed that air quality varied hugely across the town.
Our data confirmed that air quality during the early afternoon period was excellent at all locations.
Persistent and predictable poor air quality was limited to cold winter nights, with a smaller, secondary impact on subsequent mornings.
During these conditions, air quality remained generally remain good in the north-west of the town, gradually deteriorating towards the south-east. A “high risk” zone for air quality exists in an area approximately to the east of Centennial Ave and south of Boundary Street.
Our findings to date were entirely consistent with smoke from home heating being the overwhelmingly dominant source of particulate matter in the air during winter in Arrowtown. A preliminary inspection of the data revealed no evidence of a major contribution from agricultural burning, although this will be investigated further.
Read the full report detailing results from Arrowtown in 2019.
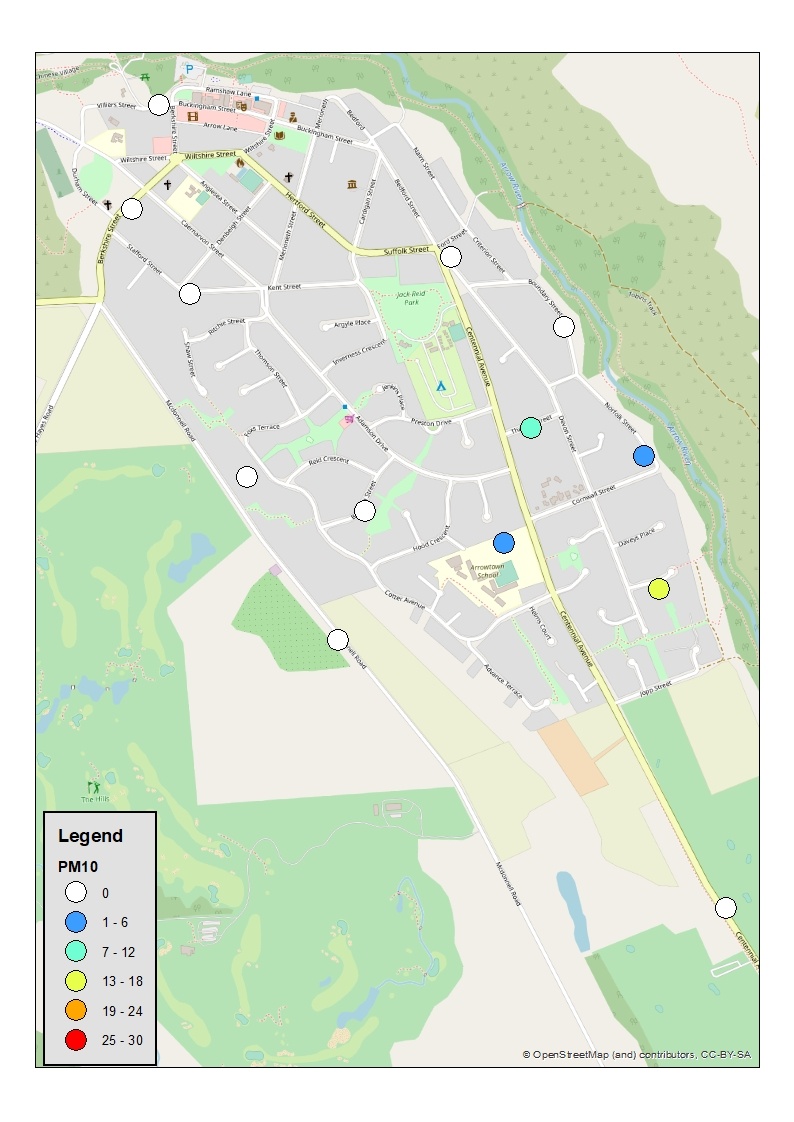
Exceedance of the National Environmental Standard for PM10 during July 2019
PM10 are particles that are less than 10 microns in diameter, or one-fifth of the diameter of human hair. In New Zealand, the main source of PM10 pollution is wood and coal burning for home heating.
Other sources include sea salt, dust, pollen and mould spores.
The map shows the number of days during July 2019 where the PM10 standard was exceeded for different locations across Arrowtown.
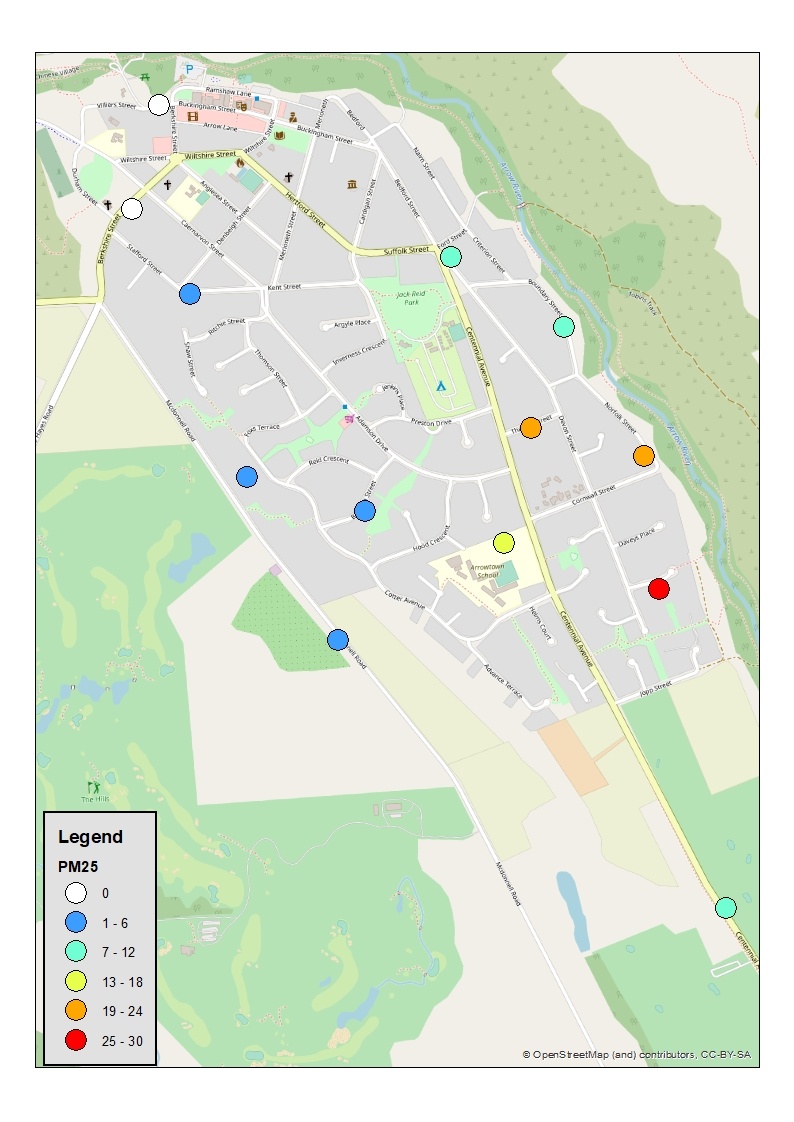
Exceedance of proposed PM2.5 standard
There is a proposal (as at June 2020) to introduce a new National Environmental Standard for PM2.5 (particulate matter less than 2.5 microns in diameter). In New Zealand, the main source of PM2.5 pollution is wood and coal burning for home heating. Minor sources include road vehicle exhaust, agricultural burning and industry.
You can read about the proposed standard for PM2.5 on the Ministry for the Environment’s website.
If that standard is adopted and air quality in Arrowtown does not change, the proportion of the town that fails to meet the standard will substantially increase compared to now, and the number of exceedances will more than double.
The map shows the number of exceedances across Arrowtown in July 2019 of that proposed standard.
2019 air quality animation videos
2019_09_01 Arrowtown Air Quality from NIWA on Vimeo.