The raw stuff of science is data. NIWA collects lots of it. Mark Blackham explores how science is being improved by connecting data across NIWA and to the outside world.
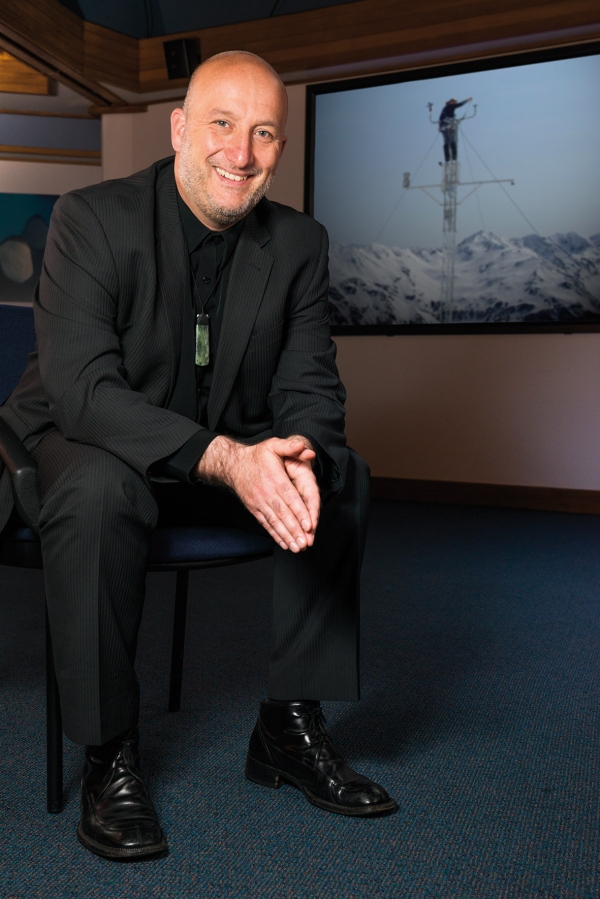
Jochen Schmidt, Chief Scientist for Environmental Information at NIWA, is on a mission to reduce wasted effort by making information easy for anyone to get to.
Schmidt, who is responsible for overseeing the management, storage and distribution of NIWA's science data, still vividly remembers a science job that took him the first six months just to find out what other scientists had done on the project beforehand.
"Six months of time just wasted in catching up. All of those data should have been sitting there waiting for me to analyse. I am working towards a future in which that never happens to anyone else.
"We want to make it easier for scientists to get existing data and to work on them. But that's only possible when information is well managed, understandable and accessible.
"To achieve that, we are working on unifying the data systems within NIWA. The grand goal is to link it across the web with other science organisations, scientists and the public."
Schmidt is standing in front of a whiteboard in NIWA's Wellington offices. Outside, the sea rages in the late winter storms. This is a scientist who has effectively given up hydrology to float instead in a sea of data.
On the whiteboard he has listed information systems that hold data collected by NIWA scientists over decades. The board is criss-crossed with lines connecting the content within the databases to each other, and in turn with the outside world.
The array of cryptic acronyms make the diagram look complicated. But Schmidt's enthusiastic and confident demeanour as he explains the links signals that he is in command of the ship. He heads NIWA's Environmental Information Centre, which is responsible for leading and managing NIWA's collection of data, its storage and its access.
"The mantra of our centre is excellent monitoring, robust data management and information interoperability," Schmidt says.
"We want to make it easier for scientists to get existing data ... But that's only possible when information is well managed, understandable and accessible."
The secret behind all of that, he explains, is consistency. "In the past, scientists recorded, managed, archived and published data in a wide range of ways. That makes it very hard or even impossible to compare research or use it again later.
"Good information management and exchange is dependent on adoption of standards – at the very least inside an organisation. In science though, which depends very much on many data sources and data sharing, standards should be universal across agencies and nations.
"NIWA regulates its data collection, management and distribution according to international standards, so data can be accessed in a consistent way. This makes it easy to retrieve, analyse and match NIWA research with other data."
The discipline of standardisation means deep thinking goes into the construction of every piece of research. What data are collected, and how they are organised, is as important as how they are collected. Schmidt and his team are continuously working on standardising everything from the 'postcard' system collecting meta information for all science data, to the tools used in the field, and automated monitoring installations.
One of the big achievements has been to build a catalogue of metadata: information about the data that NIWA are collecting. "The catalogue gives us the ability to record every NIWA dataset, with details about the sphere of science, its timing, the people working on it and the data available for access. That means researchers are more likely to get their hands on older work, before they start new studies."
Schmidt's team has pulled off an enviable achievement in only three years. They are building a system that ensures that everything NIWA has ever done, or will ever do, can be recorded and archived for the future – and every single data point can be interlinked. This means that varied types of data collected from each research project are known across the system. Scientists can bring together data from research about the life cycle of a fish species with data from separate research into the hydrology of the streams where they live.
They are achieving that by operating a series of databases in tandem. Each database is assigned responsibility for managing specific components of each piece of research. The taxa system, for example, standardises the naming conventions for species. The GIS system manages all of the geographical information, including the locations of the studies themselves. A station information system connects incoming sensor data with details about the device in the field from where they were collected. There are also systems for managing images, samples and procedures. And all are interconnected!
"Unique identifier codes match related data right across the system. It doesn't matter when and how they were collected, or whether it's numbers, maps or images. The system knows they are related so can pull them together for you," Schmidt says.
The power of the integrated database becomes apparent with a new method of preparing automatic 'reports' on topics.
For example, users of NIWA's fish database can bring up a web page or PDF that provides information on each fish species – with photos and maps of its habitat. The data presented to the user as a single document are actually drawn from different databases.
The goal of avoiding wasted time was a big driver for the automated report system. Scientists and other users don't need to spend any time collating the information themselves, or asking others to do it.
This automated system is just the tip of the 'data manipulation and access iceberg'.
"Through the standard web services which we use, data can be presented and accessed in many ways." NIWA has set up a series of open access portals so the databases can be interrogated. And all use the same standardised web services.
Why share data?
Data are the core of science, the result of observations. They record what is going on in our environment. Sharing data allows reanalysis of evidence and verification of results, and cuts down on duplication.
Reusing data, and the potential for new discoveries other than the initial purpose of the research, means there can be greater returns on investment.
The growth of digital storage capacity and computing power has made use of 'big data' a science in its own right. Scientists can combine disparately sourced, and massive, sets of data to discover new things. Computer scientist Jim Gray termed this the 'fourth paradigm'.
But reuse of data is only possible if underpinned by sound and consistent data management and data haring systems, which are connected by standards, as exemplified in this article.
For example, the LakeSPI webpage is a lake information and management tool. Users can pick out a lake by name or from a map to return information from many different studies on the ecological condition of their lake, submerged plants growing there and changes over time.
Find out more about the Environmental Information Browser
The NIWA Data Catalogue is a method of searching every recorded dataset by NIWA. It reviews metadata to help users identify specific data related to their field of interest.
Find out more about the NIWA Data Catalogue
The vision of what is being called the 'big data' revolution is that people can combine and re-examine research to discover new things.
Schmidt envisages a future where people can use NIWA data for their everyday lives. "There's an app waiting to be built which uses our data to let you know about any hazard conditions in places you're travelling to."
For now, the active challenge is connecting NIWA data are other New Zealand and international scientists.
"We've got some portals open, so some of our data are available and standardised, but there's much more work to do in getting more data into the system and connecting them with data that others have."
He says the biggest challenges for big data are getting skilled people and more people skilled. "There's a great need for data architects and curators – people who can ensure data are managed consistently [and] available for reuse by others. On the other hand, every scientist needs to be upskilled so that she or he can ensure data are managed for the future and knows how to search for data in a federated environment. Then everybody can be creators of new data products for a future with much less waste."
Schmidt thinks the early big data projects in New Zealand science are rudimentary, but advancing quickly.
"Right now it's the data scientists who are coming up with ideas for using big data. But we need scientists and clients to dream of, and ask for, the impossible. The solution to your problem is probably sitting right here in the data. You've just got to ask the right question."
Data management at NIWA: how it all works together
The NIWA database systems deal with different types of data which are all connected, including metadata, data from sensors (recorded by machines) and data from sampling (recorded by people). For example, each record in NIWA's sampling and sensor databases is linked to a record in the data catalogue of all NIWA data. Each record in the NIWA sampling database describing a species is linked to a record in the taxa system.
Observation and monitoring databases
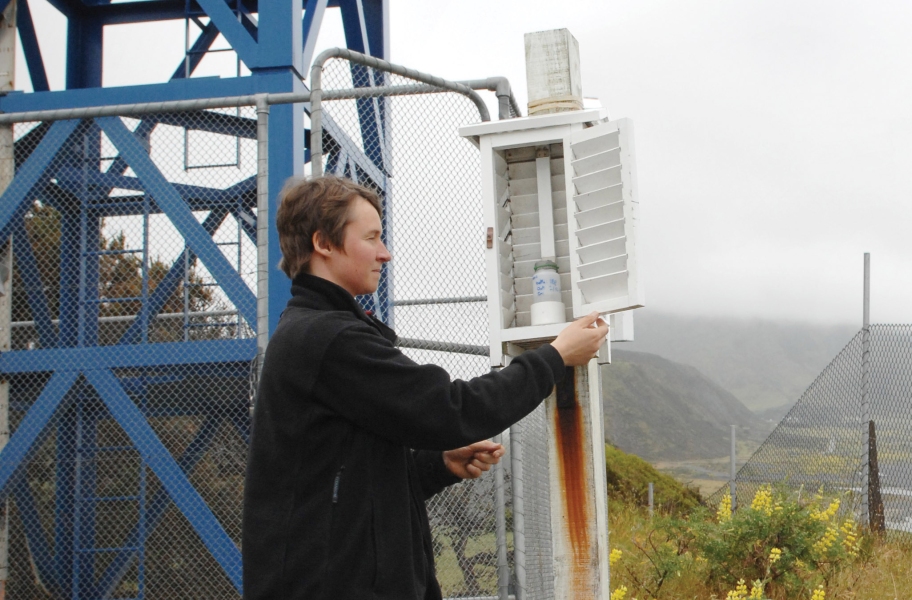
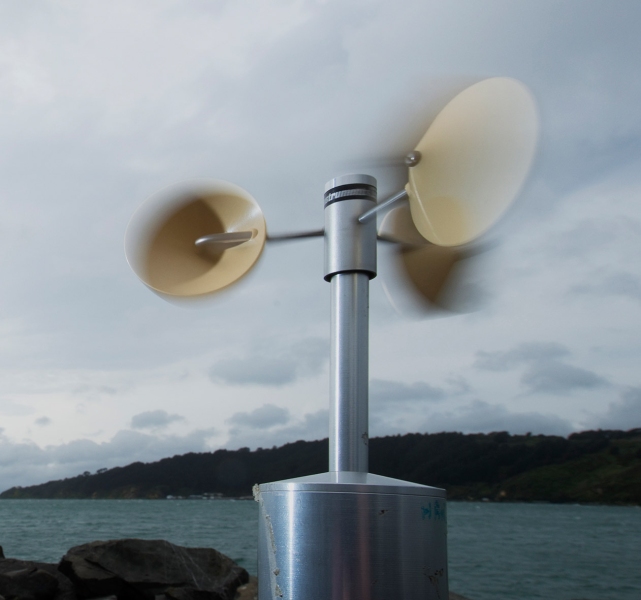
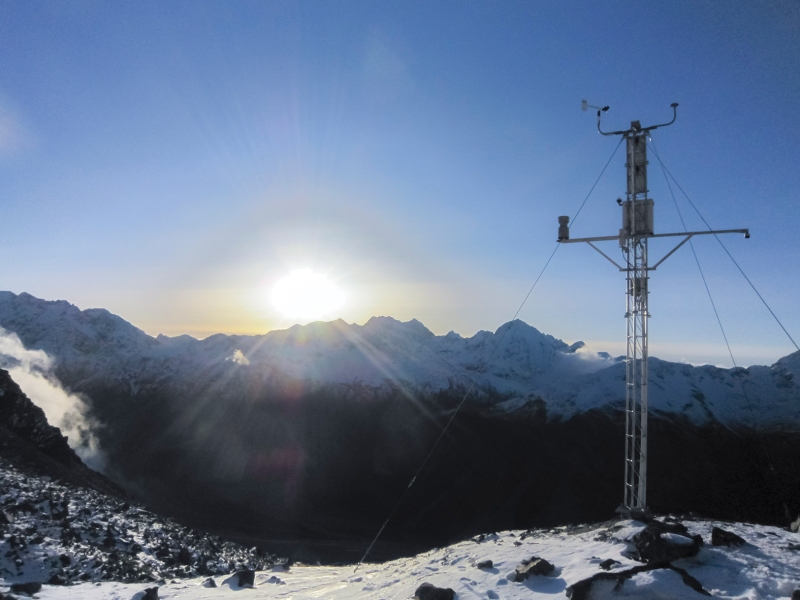
- Sensor Information Systems – recording incoming data from sensors in the field
- NIWA Environmental Monitoring and Observations System – flexible archive for storing almost any type of data collected by scientists in the field
- Marine Database – collection of marine data stored to international standards
Catalogues and vocabularies (interlinked with other systems)
- NIWA Data Catalogue – consistent meta information (to international standards) for each dataset
- Station Information Management System – information for sensor station recording data
- Taxa Information System – centralised species names management linked to the New Zealand Organism Register (NZOR); taxa information can be integrated with images and other relevant descriptive data
- Media Information Management System – consistent management of scientific images and media
- Procedures and Methods Register – catalogue of all standard methods used in data collection
Data connectors (input and output)
- Observations Ingestion System – a flexible framework for ingesting various types of observations from data providers, through web services
- NIWA Information Services Stack – information is delivered in machine-readable format through open standard web service technology
- Publishing and Reporting System – a flexible reporting system enables creation of factsheets from the data on the fly in various formats


